Eye-tracking 101

PART 1: What is eye-tracking?
Put simply, eye tracking refers to the measurement of eye activity. More specifically, eye tracking describes the recording of eye position and movement in an environment based on the optical tracking of corneal reflections to assess visual attention.
One of the first studies carried out (in 1905) used a small white speck that had to be placed directly onto the eye – the reflection from this could then be recorded. It was the first study showing the movement of eyes across time, as a dynamic process – but thankfully technology has improved since then.
PART 2: Why track a person's eyes?
Currently, eye tracking is being employed by psychologists, neuroscientists, human factor engineers, marketers, designers, architects
Market Research
Eye tracking has become a popular, increasingly vital tool in market research. Many leading brands actively utilize eye tracking to assess customer attention to key messages and advertising as well as to evaluate product performance, product and package design, and overall customer experience.
When applied to in-store testing, eye tracking provides information about the ease and difficulty of in-store navigation, search behaviour, purchase choices, wants, wishes, and desires (and conversely, dislikes, distastes, and indifference). By using gaze mapping to analyze eye tracking data it’s possible to compare multiple respondents’ attention, even if they go about it in different ways.
One of the more modern approaches to using eye tracking data has been in understanding an individual’s response to advertisements. While this article deals with the Yellow Pages (quite understandable if you’ve forgotten about them – this was in 1997), the findings reveal processes that are known to occur for other forms of advertisements too.
In particular, it was revealed that the majority of the content was simply overlooked – a worrying finding for advertisers. They also found that “consumers spent 54% more time viewing ads they end up choosing” – showing how knowledge about eye movements can inform ideas about how someone will act. The field of market and advertising research continues to advance upon these findings, gaining better and better ideas about what catches attention – and how to keep it.
Neurological Disorders
Neuroscience and psychology utilize eye tracking to analyze the sequence of gaze patterns to gain deeper insights into cognitive processes underlying attention, learning, and memory.
Eye tracking in combination with conventional research methods or other biometric sensors can help assess and potentially diagnose neurological diseases such as Attention Deficit Hyperactivity Disorder (ADHD), Autism Spectrum Disorder (ASD), Obsessive Compulsive Disorder (OCD), Schizophrenia, Parkinson‘s, and Alzheimer‘s disease.
While the methods were all but modern (“field potential generated by the corneo-retinal potential were recorded on a Beckman type R Dynograph as eye movement…”), the discovery of this study was certainly groundbreaking. This article by Philip Holzman and colleagues found that the eye movements of schizophrenic patients were significantly different to eye movements of non-schizophrenic patients (and not impacted by “motivational or attentional factors”) – suggesting that a definable and solely biological difference had been found – the holy grail of schizophrenia research.
The article has been cited close to 500 times and has spawned a whole new area of study for researchers investigating schizophrenia. It also showed the importance of considering eye movements as a biomarker for neurological disorders – opening up new ways to discover and define the disease.
Human-computer interaction
This article by Robert Jacob was one of the first to consider the use of eye-tracking technology to guide human-computer interaction. The article was published in 1991, and therefore has to consider the different eye tracking methods available at the time (some of which involve a “bite-board” to keep the head stationary – thankfully hardware has improved since then).
The discussion of the article builds upon previous work that centred around using eye tracking as assistive technology – helping individuals with disabilities, yet focuses on methods that also involve “more conventional modes of user-computer communication”. The emphasis is therefore not only on human-computer interaction but computer-human interaction. While this article is essentially ancient in eye tracking history (a quarter of a century is a long time in this field), it laid the groundwork for many of the human-computer interaction endeavours that we see today.
Web Testing

A rapidly growing field that utilizes eye tracking as a methodology for assessment is usability and user experience testing. Eye tracking for website testing is an often utilized approach, giving insights into how websites are viewed and experienced. How do people attend to adverts, communication, and calls to action (CTAs)?
If you‘re losing out on revenue, eye tracking data can deliver valuable insights into the gaze patterns of your website visitors – how long does it take them to find a specific product on your site, what kind of visual information do they ignore (but are supposed to see)?
Cut to the chase and see exactly what goes wrong. The very same investigations can even be applied to mobile apps on tablets and smartphones.
PART 3: How eye-tracking works?
Pupil Center Corneal Reflection
Most modern eye trackers utilize near-infrared technology along with a high-resolution camera (or other optical sensors) to track gaze direction. The underlying concept commonly referred to as Pupil Center Corneal Reflection (PCCR), is actually rather simple.
It essentially involves the camera tracking the pupil centre, and where light reflects from the cornea. An image of how this looks like is on the right. The math behind it is …well, a bit more complex. We won‘t bore you with the nature of algorithms at this point.

Why infrared spectrum imaging?
The accuracy of eye movement measurement heavily relies on a clear demarcation of the pupil and detection of corneal reflection. The visible spectrum is likely to generate uncontrolled specular reflection, while illuminating the eye with infrared light – which is not perceivable by the human eye – renders the demarcation of the pupil and the iris an easy task – while the light directly enters the pupil, it just reflects from the iris.
Near-infrared light is directed toward the centre of the eyes (the pupils) causing visible reflections in the cornea (the outer-most optical element of the eye), which are tracked by a camera.
PART 4: Eye Tracker vs. Eye Tracking Glasses

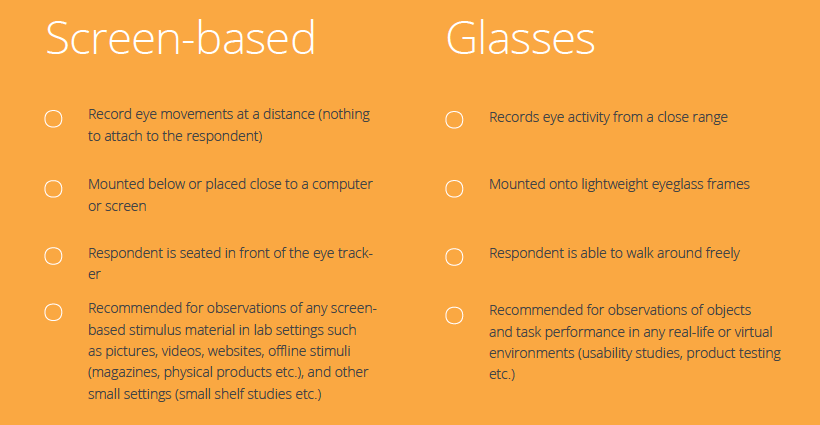
Eye tracking can be split into two distinct categories; screen-based eye tracking (also called stationary or desktop eye tracking) and mobile eye tracking.
Screen-based eye trackers:
Require respondents to sit in front of a screen or close to the stimulus being used in the experiment. Although screen-based systems track the eyes only within certain limits, they are able to move a limited amount, as long as it is within the limits of the eye tracker’s range. This range is called the headbox. The freedom of movement is still sufficiently large for respondents to feel unrestricted.
Eye tracking glasses:
Are fitted near the eyes and therefore allow respondents to move around as freely as they would like – certainly a plus if your study design requires respondents to be present in various areas (e.g. a large lab setting, or a supermarket).
Precision and accuracy differences
Precision and accuracy are critical in research using eye movements. The outcome highly depends on the tracking accuracy of the device, so using a low-quality system may be detrimental when extracting high precision data.
A common misconception is that all screen-based eye trackers have a higher level of precision and accuracy than eye tracking glasses.
The precision depends a lot on the type of research the tracker is used for. Eye tracking glasses are fixed to the eye, where no head movement can interfere with data capture which is great for research where the respondents have to move around (e.g. in-store studies).
A screen-based eye tracker has only a certain window in that the head can move without losing connection and with its accuracy and precision.
Eye tracking glasses, on the other hand, compensate for movements if calibrated properly and therefore can be very precise.
However, researchers must take into account the intrusive nature of such hardware when designing an experiment. Therefore, a screen-based tracker might be better for stationary setups on a screen (e.g. website testing).
Situations suitable for the different setups
Generally, screen-based eye tracking is mostly recommended for screen-based stimuli, meaning anything that can be shown on a screen or computer monitor. This includes stimuli like still images, videos, computer games, websites and much more.
However, it also works well for books, magazines, small shelves, etc. Eye tracking glasses work best for three-dimensional environments (e.g. in a shop) or when the respondent needs to move (movability element). In limited cases, screen-based eye tracking could also be used with an environment like a shelf, but it has the limitation that the respondents need to stand still and within a specified proximity so that their eyes can be captured correctly.
In-Store Testing with Eye Tracking Glasses
In limited cases, screen-based eye tracking could also be used with an environment like a shelf, but it has the limitation that the respondents need to stand still and within a specified proximity so that their eyes can be captured correctly.
PART 5: Key specifications for eye-tracking software

Measurement precision:
Measured in degrees. Standard is about 0.5 degree. Low-end hardware starts at around 1.0 degree, medium 0.5 degrees, and high end at 0.1 degrees or even less.
Trackability:
How much of the population can be tracked? The best systems track around 95% of the population, low-end systems less.
Sampling rate:
How many times per second is the eye position measured? Typical value range is 30-60 Hz. Special research equipment records at around 120-1000+ Hz.
Headbox size:
To what extent is the respondent allowed to move in relative distance to the eye tracker? A good system will typically allow around 11 inches (28cm) of movement in each direction.
Recapture rate:
How fast does the eye tracker detect the eye position after the eyes have been out of sight for a moment (e.g. during a blink)?
Integrated or standalone:
Is the eye tracking hardware integrated into the monitor frame? Standalone eye trackers usually offer high-end specifications but are also typically a bit more complex to set up.
Does your provider offer support?
With most eye trackers, you can usually run your eye tracker out of the box. To get started, however, a live training is helpful to learn the ropes.
PART 6: Free eye-tracking technologies

PART 7: Analysing eye-tracking data
In order to understand eye-tracking data, we need to analyse it. How we do so, however, hasn’t always been so clear. It was only with this publication by Dario Salvucci and Joseph Goldberg that the analytical methods were assessed and compared. By doing so, they provided a standardized process for the analysis methods to be judged, rather than continuing with fragmented comparisons.
The article has been cited almost 1000 times and has made a huge impact on the understanding of eye tracking research, by giving an evidential basis for how fixations and saccades should be defined. As so many of the findings of eye tracking research relate to these factors, having a defined method for their understanding was crucial for the field to progress.
Fixation and Gaze points
Without a doubt, the terms fixation and gaze points are the most prominent metrics in eye tracking literature.
Gaze points constitute the basic unit of measure – one gaze point equals one raw sample captured by the eye tracker. The math is easy: If the eye tracker measures 60 times a second, then each gaze point represents a sixtieth of a second (or 16.67 milliseconds).
If a series of gaze points happen to be close in time and range, the resulting gaze cluster denotes a fixation, a period in which our eyes are locked toward a specific object. Typically, the fixation duration is 100 – 300 milliseconds.
The eye movements between fixations are known as saccades. What are they exactly? Take reading a book, for example. While reading, your eyes don’t move smoothly across the line, even if you experience it like that. Instead, your eyes jump and pause, thereby generating a vast number of discrete sequences. These sequences are called saccades.
Perceptual span and smooth pursuit
Reading involves both saccades and fixations, with each fixation involving a perceptual span. This refers to the number of characters we can recognise on each fixation, between each saccade. This is usually 17-19 letters, dependent on the text. Experienced readers have a higher perceptual span compared to early readers, and can, therefore, read faster.
Imagine watching clouds in the sky as you pass your time waiting at the bus stop. As you now know about saccades, you might expect your eye movements to in this scenario to behave in the same way – but the rules are a bit different for moving objects. Unlike reading, locking your eyes toward a moving object won’t generate any saccades, but a smooth pursuit trajectory. This way of seeing operates as you might expect – the eyes smoothly track the object. This occurs up to 30°/s – at speeds beyond this, saccades are used to catch up to the object.
As fixations and saccades are excellent measures of visual attention and interest, they are most commonly used to fuel discoveries with eye tracking data.
Now let‘s get practical and have a look at the most common metrics used in eye tracking research (that are based on fixations and gaze points) and what you can make of them.
Heatmaps

Heat maps are static or dynamic aggregations of gaze points and fixations revealing the distribution of visual attention.Following an easy-to-read color-coded scheme, heat maps serve as an excellent method to visualize which elements of the stimulus were able to draw attention – with red areas suggesting a high number of gaze points (and therefore an increased level of interest), and yellow and green areas showing fewer gaze points (and therefore a less engaged visual system. Areas without colouring were likely not attended to at all.
Areas of Interest (AOI)

Areas of Interest also referred to as AOIs, are user-defined subregions of a displayed stimulus. Extracting metrics for separate AOIs might come in handy when evaluating the performance of two or more specific areas in the same video, picture, website or program interface. This can be performed to compare groups of participants, conditions, or different features.
Fixation sequences

Based on fixation position (where?) and timing information (when?) you can generate a fixation sequence. This is dependent on where respondents look and how much time they spend, and provides insight into the order of attention, telling you where respondents looked first, second, third etc. This is a commonly used metric in eye tracking research as it reflects salient elements (elements that stand out in terms of brightness, hue, saturation etc.) in the display or environment that are likely to catch attention.
Time to First Fixation (TTFF)
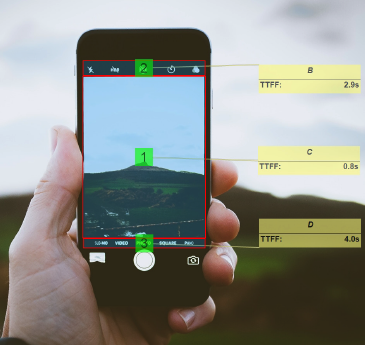
The time to the first fixation indicates the amount of time it takes a respondent to look at a specific AOI from stimulus onset. TTFF can indicate both bottom-up stimulus-driven searches (a flashy company label catching immediate attention, for example) as well as top-down attention is driven searches (respondents actively decide to search for certain elements or areas on a website, for example). TTFF is a basic yet very valuable metric in eye tracking.
Time spent

Time spent quantifies the amount of time that respondents spent looking at an AOI. As respondents have to blend out other stimuli in the visual periphery that could be equally interesting, the amount of time spent often indicates motivation and conscious attention (prolonged visual attention at a certain region clearly points to a high level of interest, while shorter times indicate that other areas on screen or in the environment might be more catchy).
Respondent count

The respondent count describes how many of your respondents actually guided their gaze towards a specific AOI. A higher count shows that the stimulus is widely attended to, while a low count shows that little attention is paid to it.
Advanced eye tracking metrics
– More than meets the eye
With the core tools at hand, you‘re perfectly equipped to track the basics. You can now find out where, when and what people look at, and even what they fail to see. So far, so good.
Now how about pushing your insights a bit further and stepping beyond the basics of eye tracking?
Pupil size / dilation
An increase in pupil size is referred to as pupil dilation, and a decrease in size is called pupil constriction.
Pupil size primarily responds to changes in light (ambient light) or stimulus material (e.g. video stimulus). However, if the experiment can account for light, other attributes can be derived from changes in pupil size. Two common properties are emotional arousal(referring to the amount of emotional engagement) and cognitive workload (which refers to how mentally taxing a stimulus is).
In most cases, pupillary responses are used as a measure of emotional arousal. However, be careful with overreaching conclusions as pupillary responses alone don’t give any indication of whether arousal arises from a positive (“yay“!) or negative stimulus (“nay!“).
Distance to the screen
Along with pupil size, eye trackers also measure the distance to the screen and the relative position of the respondent. Leaning forwards or backwards in front of a remote device is tracked directly and can reflect approach-avoidance behaviour. However, keep in mind that interpreting the data is always very specific to the application.
Ocular Vergence
Most eye trackers measure the positions of the left and right eyes independently. This allows the extraction of vergence, i.e., whether left and right eyes move together or apart from each other. This phenomenon is just a natural consequence of focusing near and far. Divergence often happens when our mind drifts away when losing focus or concentration. It can be picked up instantly by measuring inter-pupil distance.
Blinks
Eye tracking can also provide essential information on cognitive workload by monitoring blinks. Cognitively demanding tasks can be associated with delays in blinks, the so-called attentional blink. However, many other insights can be derived from blinks. A very low frequency of blinks, for example, is usually associated with higher levels of concentration. A rather high frequency is indicative of drowsiness and lower levels of focus and concentration.
Subconscious & conscious processing
The figure below illustrates how subconscious processing of a stimulus occurs before our conscious processing kicks in.

As an objective measure, eye tracking indicates:
which elements attract immediate attention
which elements attract above-average attention
if some elements are being ignored or overlooked
in which order the elements are noticed

Facial Expression Analysis
Facial expression analysis is a non-intrusive method to assess emotional reactions throughout time. While facial expressions can measure the presence of an emotion (valence), they can’t measure the intensity of that emotion (arousal).
EEG
Electroencephalography is a technique that measures the electrical activity of the brain at the scalp. EEG provides information about brain activíty during task performance or stimulus exposure. It allows for the analysis of brain dynamics that provide information about the levels of engagement (arousal), motivation, frustration, cognitive workload. Other metrics can also be measured that are associated with stimulus processing, action preparation, and execution.
GSR (EDA)
Galvanic skin response (or electrodermal activity) monitors the electrical activity across the skin generated by physiological or emotional arousal. Skin conductance offers insights into the respondents’ subconscious arousal when being confronted with emotionally loaded stimulus material
EMG
Electromyographic sensors monitor the electric activity of muscles. You can use EMG to monitor muscular responses to any type of stimulus material to extract even subtle activation patterns associated with emotional expressions (facial EMG) or consciously controlled hand/finger movements.
ECG & PPG
Electrocardiography (ECG) and photoplethysmography (PPG) allow for recording of the heart rate or pulse. You can use this data to obtain insights into respondents’ physical state, anxiety and stress levels (arousal), and how changes in physiological state relate to their actions and decisions.
For more information click here