Prompt Engineering Sales Forecasts
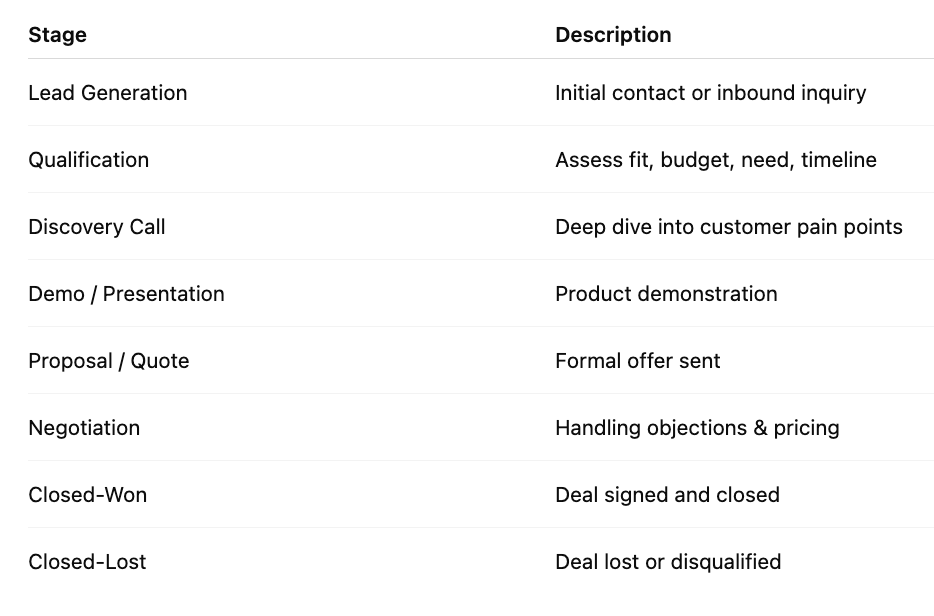
1. Define Sales Pipeline Stages
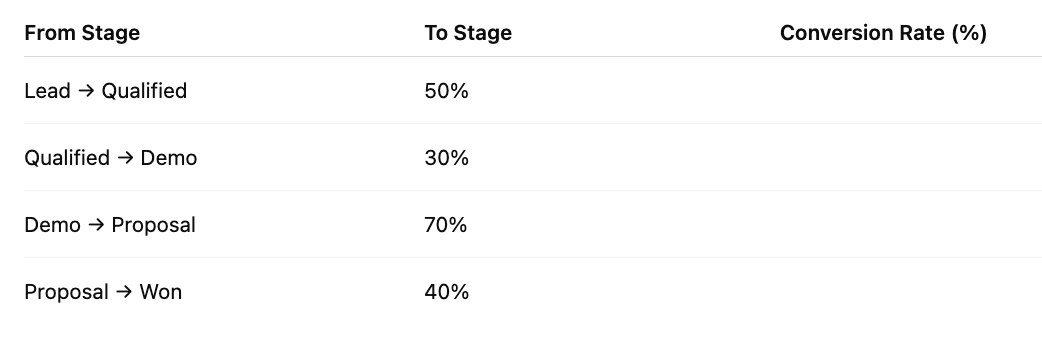
2. Assign Conversion Rates Between Stages
3. Estimate Average Deal Size & Sales Cycle Length
Define average deal value ($) based on past sales or market data.
Define average sales cycle duration (days/weeks/months) from lead to close.
This helps estimate timing and revenue per deal.
4. Build Your Pipeline Inventory
List all current leads/opportunities by stage.
For new leads, estimate expected leads per month based on marketing/sales efforts.
Track the number and value of opportunities at each stage continuously.
5. Calculate Weighted Pipeline Value
Apply conversion probability (from step 2) to each opportunity value.
Weighted Value = Opportunity Value × Probability of Closing
This gives a more realistic expected revenue figure.
6. Develop Monthly Sales Forecast
For each month over the next 12 months:
Forecast number of new leads generated.
Forecast pipeline progression based on sales cycle length and stage conversion rates.
Forecast weighted revenue expected to close that month.
You can use a rolling forecast model that updates regularly based on pipeline changes.
7. Incorporate Seasonality and Market Trends
Adjust forecasts for seasonality (e.g., slower in summer, budget cycles at year-end).
Factor in market trends or planned product launches, promotions, or sales campaigns.
8. Monitor Key Sales Metrics
Track regularly to validate and adjust the forecast:
Lead-to-opportunity conversion rate
Opportunity-to-win conversion rate
Average deal size trend
Sales cycle duration changes
Pipeline coverage ratio (pipeline value vs. sales target)
9. Review and Adjust Forecast Regularly
Hold monthly or quarterly pipeline review meetings.
Update forecast based on real-time pipeline status, closed deals, lost deals, and new inputs.
Identify pipeline gaps early and adjust sales or marketing efforts accordingly.
10. Use Tools & Dashboards
Use CRM systems (Salesforce, HubSpot, etc.) to track pipeline data.
Create dashboards visualizing pipeline stages, forecast by month, conversion rates.
Automate reporting to enable data-driven decision making.
Prompt Engineering
Tab 1: Sales Pipeline Stages
Instruction:
Create a table with columns: Stage Name, Description, Key Criteria / Actions.
For {{company_name}}, list each sales pipeline stage with a brief description and the main criteria or actions required to move a lead into this stage.
Tab 2: Conversion Rates Between Stages
Instruction:
Create a table with columns: From Stage, To Stage, Conversion Rate (%).
Input the historical or benchmark percentage rates representing how leads convert from one pipeline stage to the next for {{company_name}}.
Tab 3: Average Deal Size & Sales Cycle Length
Instruction:
Create a table with columns: Product / Service, Average Deal Size ($), Average Sales Cycle Length (days).
Enter estimated average deal values and typical sales cycle durations per product or service offered by {{company_name}}.
Tab 4: Pipeline Inventory
Instruction:
Create a table with columns: Lead / Opportunity, Stage, Estimated Value ($), Expected Close Date.
List all current leads and opportunities by their pipeline stage, estimated deal value, and anticipated closing date for {{company_name}}.
Tab 5: Weighted Pipeline Value
Instruction:
Create a table with columns: Lead / Opportunity, Stage, Estimated Value ($), Probability (%), Weighted Value ($).
For each opportunity, calculate the weighted value by multiplying estimated deal value by the probability of closing (derived from the stage conversion rate) for {{company_name}}.
Tab 6: Monthly Sales Forecast
Instruction:
Create a table with columns: Month, New Leads, Pipeline Value ($), Weighted Pipeline ($), Expected Closed Revenue ($), Notes.
Forecast monthly sales metrics for the next 12 months for {{company_name}}, including new leads, total pipeline value, weighted pipeline value, and expected revenue closed each month.
Tab 7: Seasonality & Market Trends Adjustments
Instruction:
Create a table with columns: Month, Seasonal Adjustment (%), Market Trend Adjustment (%), Campaign Impact ($), Adjusted Forecast ($).
Adjust your monthly sales forecast to account for seasonality, market trends, and marketing campaigns for {{company_name}}.
Tab 8: Sales Metrics Monitoring
Instruction:
Create a table with columns: Month, Lead-to-Opportunity (%), Opportunity-to-Win (%), Average Deal Size ($), Sales Cycle Length (days), Pipeline Coverage Ratio (%).
Track and monitor key sales metrics monthly to validate and improve the forecasting accuracy for {{company_name}}.
Tab 9: Forecast Review & Adjustment Log
Instruction:
Create a table with columns: Date, Participants, Key Updates / Findings, Actions / Next Steps, Owner.
Log notes and outcomes from monthly or quarterly forecast review meetings for {{company_name}}, capturing updates, identified gaps, decisions, and owners responsible.
Tab 10: Tools & Dashboards Setup
Instruction:
Create a table with columns: Tool / Platform, Purpose, Key Dashboards / Reports, Owner / Admin, Notes.
Document the CRM systems, dashboards, and automation tools used by {{company_name}} to track and visualize sales pipeline and forecasting data.