Fling, Series A: $21M Raised
FLING
Series A: $21M Raised
A venture-backed dating platform focused on social connection, events, and marketplace-driven engagement.
Consumer Research & Insights
Led workshops, user interviews, and structured surveys to validate product-market fit.
Developed comprehensive consumer research reports with:
Behavioral segmentation
User personas & archetypes
Dating motivations & friction analysis
Feature desirability mapping
Translated qualitative and quantitative findings into actionable product strategy.
Impact: Ensured roadmap decisions were evidence-based and aligned with user needs at scale.
UX Strategy & Product Design
Created low- and high-fidelity wireframes across core product flows.
Developed interactive prototypes to test usability before engineering investment.
Designed and optimized:
Onboarding journey
Messaging experience
Social network layer
Events & Groups discovery
Marketplace interactions
Impact: Reduced usability friction and improved early user engagement metrics.
Business Analysis & Technical Documentation
Authored detailed Technical Requirement Documents (TRDs) for:
Onboarding
Messaging
Social Network
Events
Groups
Marketplace
Each included:
Defined user stories
Acceptance criteria
Edge cases
Functional specifications
User journey mapping
KPI alignment
Impact: Streamlined engineering execution and reduced ambiguity across cross-functional teams.
Product Roadmap & Project Management
Built and maintained a multi-quarter product roadmap aligned with Series A growth targets.
Created IT project management Gantt charts to track dependencies, sprints, and feature releases.
Coordinated between engineering, design, marketing, and leadership stakeholders.
Impact: Maintained delivery cadence and alignment during rapid scaling.
Agile Product Leadership
Led daily stand-ups and sprint planning sessions.
Operated in two-week release cycles to rapidly test and iterate.
Implemented hypothesis-driven feature launches.
Gathered user feedback post-release to validate assumptions.
Impact: Enabled rapid experimentation and continuous product optimization.
Quality Assurance & UAT
Conducted User Acceptance Testing (UAT) prior to production releases.
Logged and prioritized bugs in collaboration with QA engineers.
Ensured feature stability and production readiness.
Impact: Maintained product reliability during accelerated release cycles.
From Dating App to Predictive Intelligence Platform
Let me start with a structural shift.
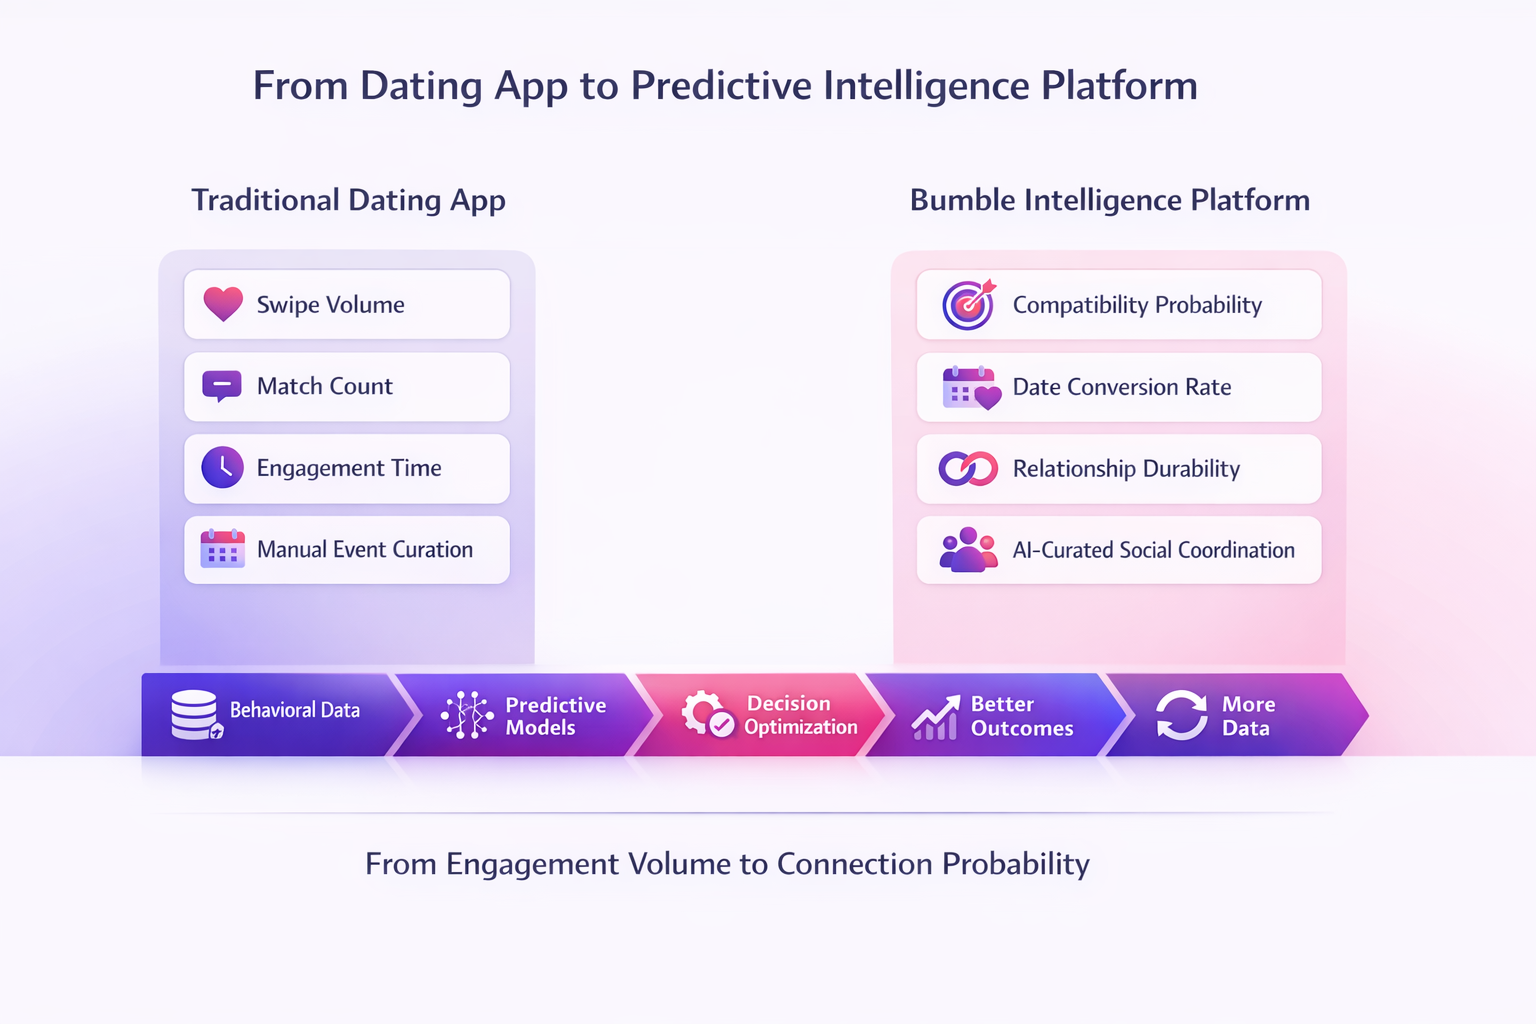
Historically, dating platforms have optimized engagement volume — swipes, time spent, and match count. That model maximizes activity, not outcomes.
What we are building instead is a decision-quality optimization engine.
On the left side of this slide, you see the legacy metrics framework — swipe volume and match count. On the right, you see our framework — compatibility probability, date conversion, and relationship durability.
The difference is fundamental.
Rather than increasing interaction density, we increase connection probability. This reframes the company from a media-style engagement business into a predictive infrastructure platform.
The strategic implication is that value scales with intelligence accumulation, not with superficial activity.
Intelligence Stack Overview
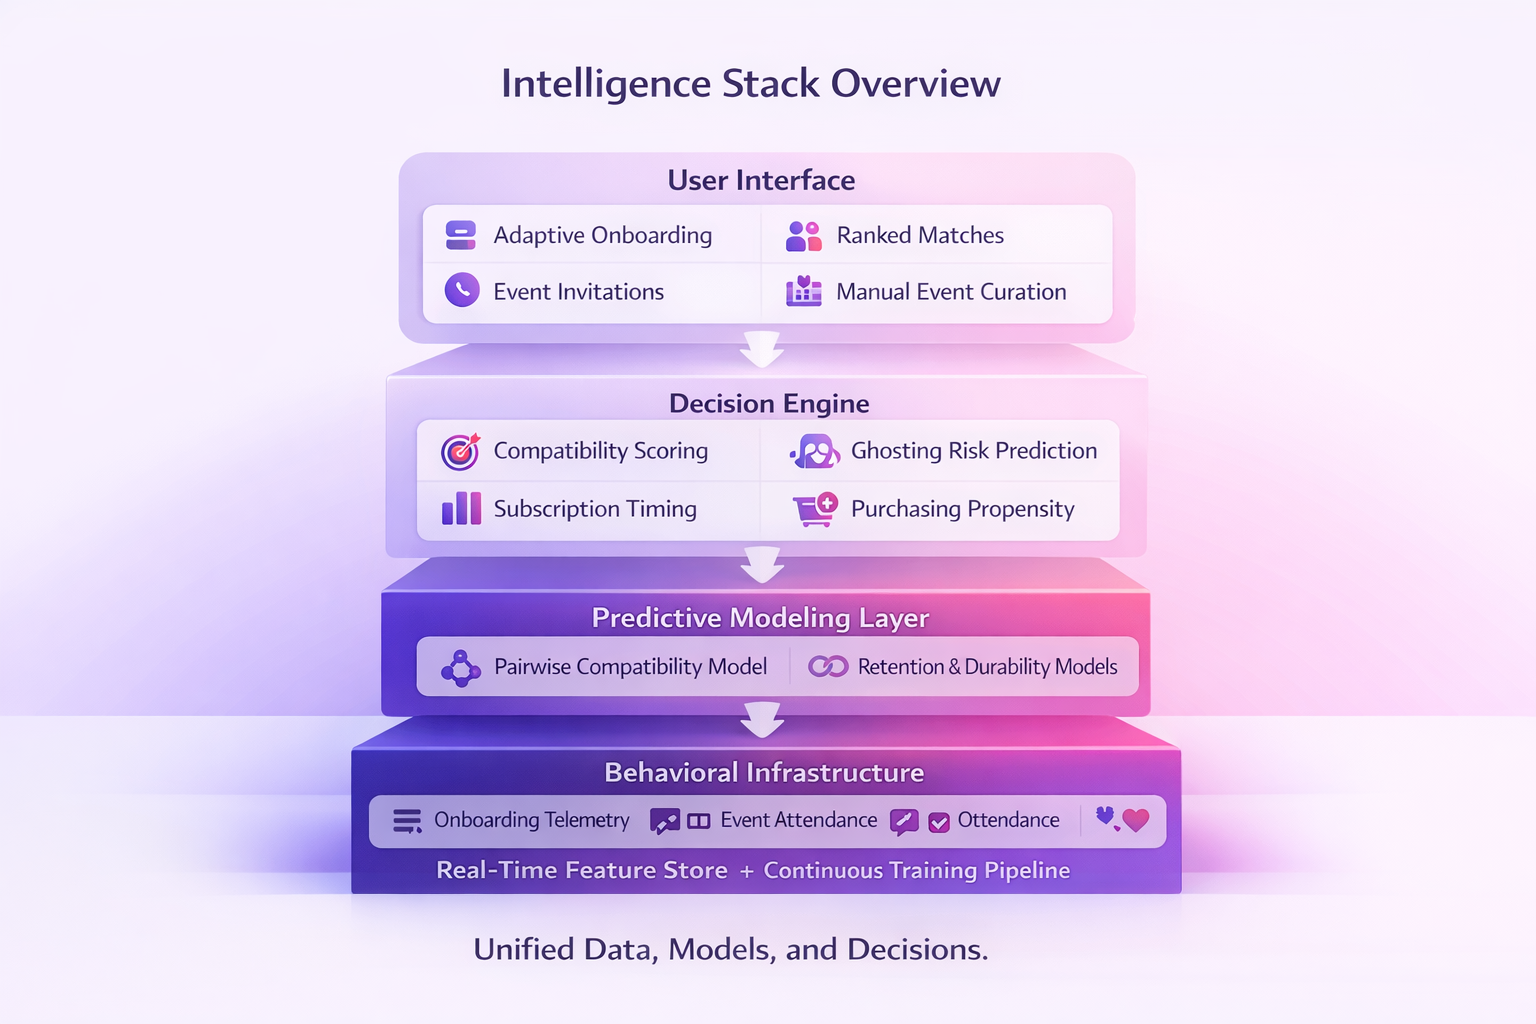
This slide outlines our full intelligence stack.
At the top layer is the user interface — adaptive onboarding, ranked matches, event invitations. These are visible manifestations of a deeper system.
Underneath is the decision engine. This is where compatibility scoring, ghosting risk prediction, and subscription timing decisions occur.
Below that is the predictive modeling layer — trained continuously on outcome-labeled data.
At the foundation is behavioral infrastructure: telemetry across onboarding, messaging, events, and relationship progression.
The key insight here is vertical integration. Data, model, and decision execution are unified. That architecture enables compounding predictive advantage.
Predictive Intelligence Flywheel
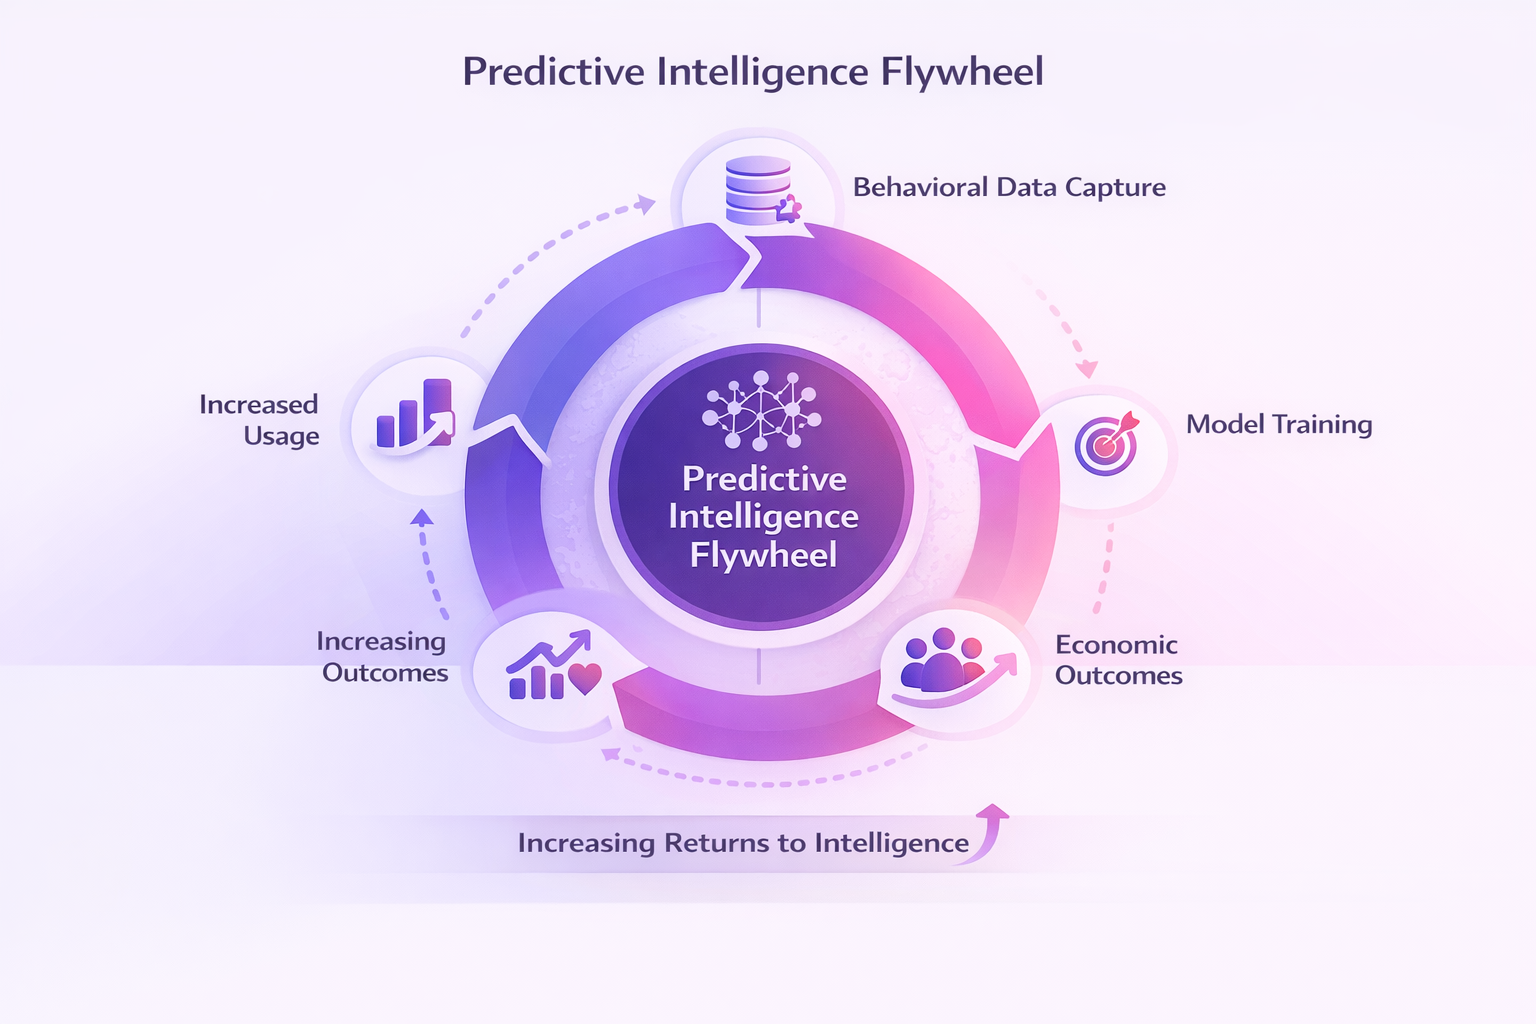
This is the operating core of the platform — the Predictive Intelligence Flywheel.
We capture behavioral data.
We train models to estimate compatibility and lifecycle progression.
We optimize decisions — match ranking, event curation, monetization timing.
Those improved decisions generate better economic and relational outcomes.
Improved outcomes increase engagement and retention, generating more data.
Each loop increases model accuracy.
The flywheel produces increasing returns to intelligence. Over time, this creates structural defensibility because prediction quality compounds.
KPI Transformation
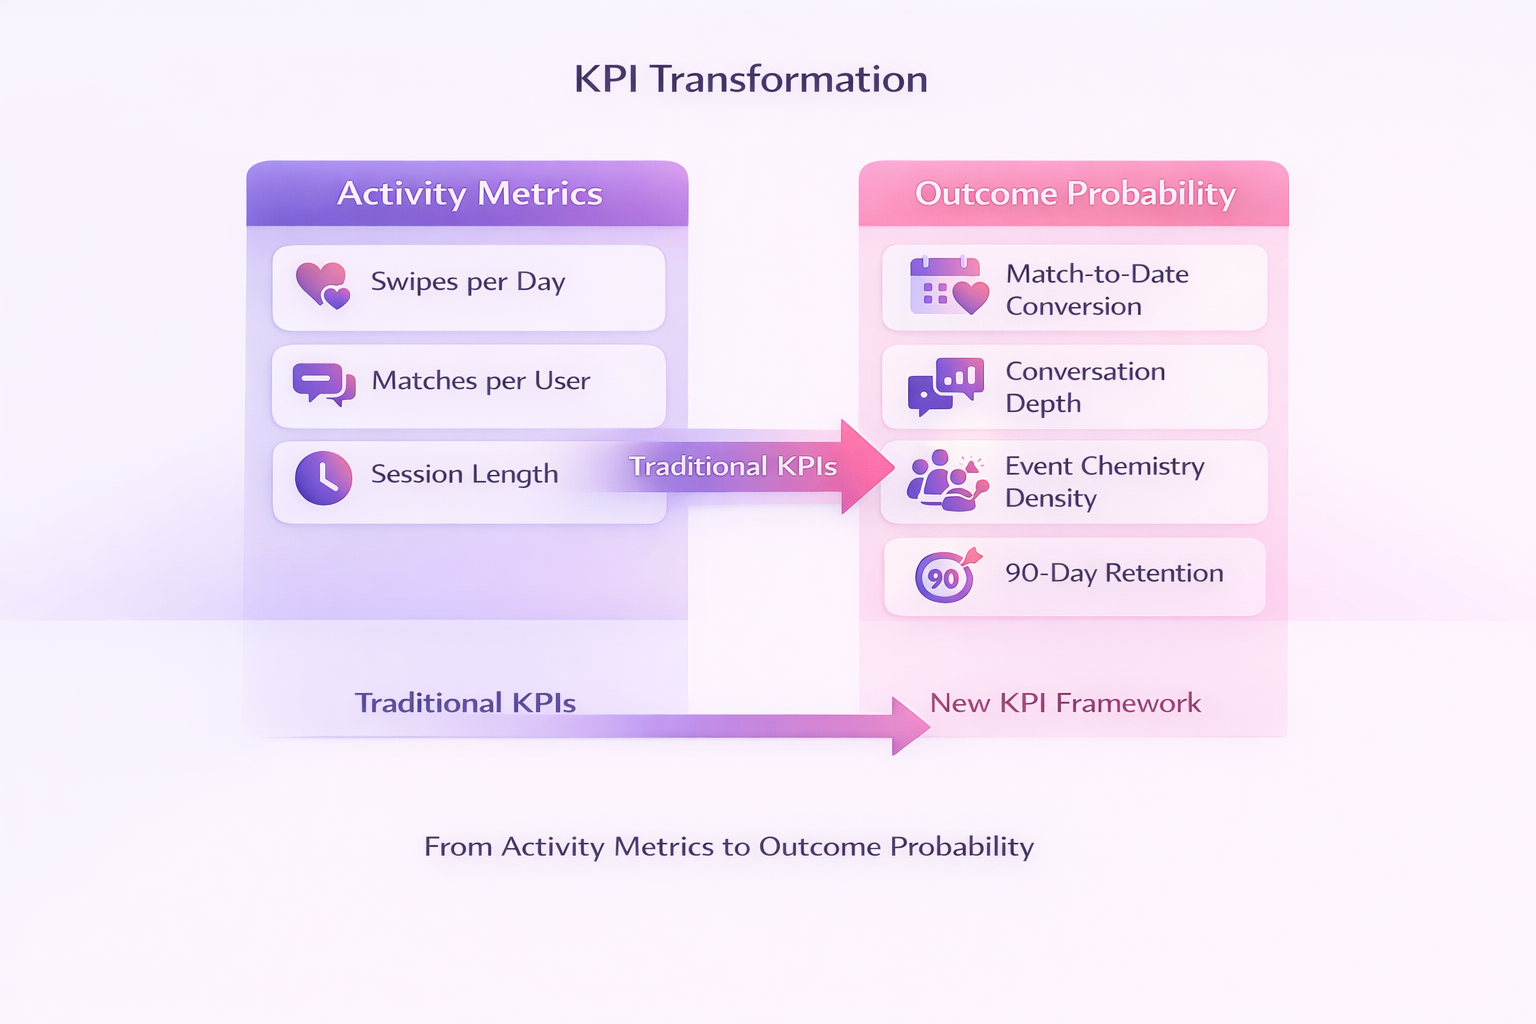
This slide shows the shift in what we measure.
Traditional KPIs focus on activity metrics — swipes per day, matches per session.
Our KPI framework measures outcome probability: match-to-date conversion, conversation depth, event chemistry density, 90-day retention.
When we change what we optimize, we change what the system becomes.
By measuring connection outcomes instead of interaction volume, we align the product with durable user value and long-term monetization.
Quantified Results
Here we illustrate the impact of predictive optimization.
When compatibility ranking improves, match-to-date conversion increases materially. That drives retention. Retention drives subscription conversion.
The important point is nonlinear impact.
A modest increase in compatibility prediction accuracy generates disproportionate gains in lifetime value.
This is the economic signature of intelligence compounding.
Compounding Intelligence Economics
This diagram shows the economic mechanics.
More users generate more behavioral data.
More data improves model accuracy.
Better models increase connection success.
Connection success increases retention and LTV.
Higher LTV supports reinvestment and user growth.
The critical feature here is that marginal cost per user declines while marginal revenue per user increases with intelligence.
That is increasing returns to scale — not from network size alone, but from prediction quality.
Defensibility Map
This slide outlines our structural moats.
First, data network effects. Outcome-labeled compatibility data cannot be easily replicated.
Second, model compounding. Prediction accuracy improves with historical training depth.
Third, switching costs. If decision quality is higher here than elsewhere, switching imposes an economic penalty on users.
Fourth, offline outcome integration. Event-based compatibility signals create a dataset that pure digital competitors lack.
These moats compound over time. They are structural, not feature-based.
Lifecycle Intelligence Overlay
This infographic shows where intelligence operates across the user lifecycle.
Onboarding generates latent personality vectors.
Matching applies pairwise compatibility prediction.
Messaging optimizes conversation trajectory.
Events optimize group chemistry.
Post-date feedback strengthens durability modeling.
Subscription timing aligns with demonstrated value.
Intelligence is not a feature. It is embedded across every decision node.
Strategic Positioning
This slide reframes our market identity.
On the left is a dating marketplace. On the right is social decision infrastructure.
Marketplaces facilitate transactions. Infrastructure optimizes decisions.
If we consistently improve compatibility probability, we become embedded in the most consequential personal decisions users make.
That elevates switching costs and valuation multiples.
Autonomous Social Coordination
“This is the long-term horizon.
The system predicts who should meet, where they should meet, and when they should meet.
Over time, orchestration becomes increasingly autonomous.
We move from reactive match suggestions to proactive social coordination.
At that point, the platform becomes a continuously learning compatibility engine — a social optimization infrastructure with compounding economic advantage.