Monetising Bumble
At Bumble, I led the development of a real-time AI-driven risk scoring and payment routing system that reframed fraud prevention as an expected revenue optimization problem. By embedding low-latency ML inference directly into checkout and implementing risk-based routing logic, we increased payment success rates, reduced fraud losses, and significantly improved overall monetization efficiency.
1. Platform Overview
“The Economic Intelligence Layer”
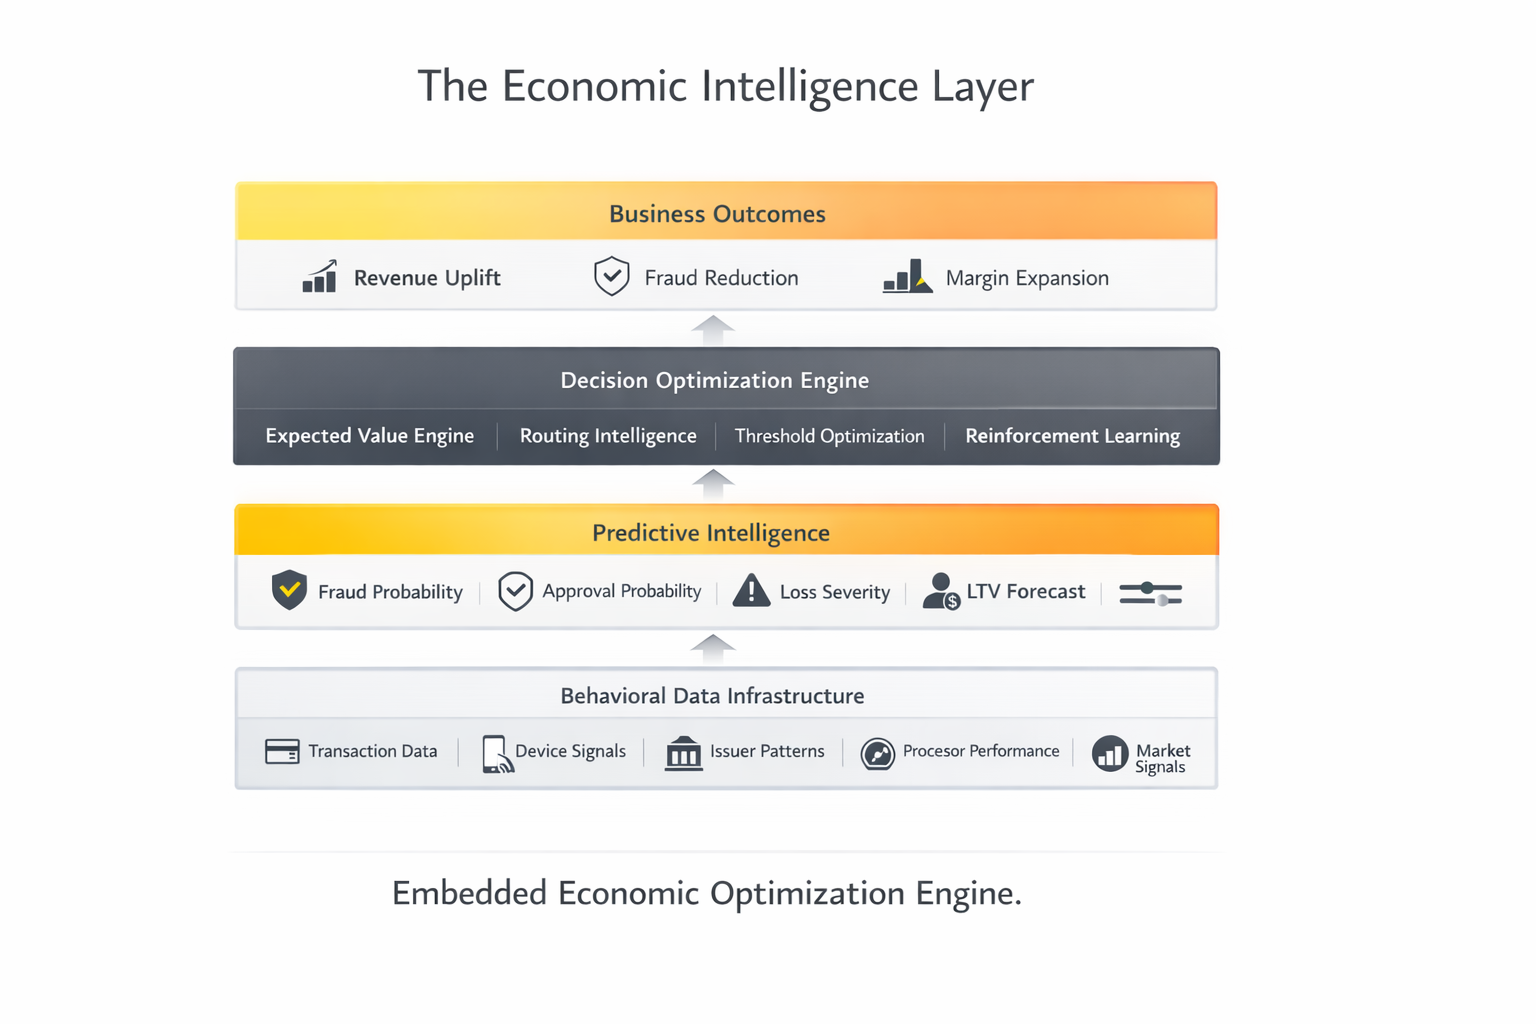
What you’re looking at here is Monetisation Engine structured as a layered system.
At the foundation is behavioral data — every transaction, issuer response, device signal, and processor outcome.
Above that sits the predictive intelligence layer. We’re not just predicting fraud. We’re forecasting approval probability, fraud severity, lifetime value, and friction sensitivity.
Those predictions feed into our decision optimization engine. This is where we compute expected value per transaction and determine routing, threshold, and verification policies in real time.
At the top are business outcomes — revenue uplift, fraud reduction, and margin expansion.
The key point is that this is not a fraud tool or a routing tool. It is an embedded economic optimization engine. Every transaction becomes a probabilistic economic decision.
2. Core Economic Equation
“From Fraud Blocking to Revenue Optimization”
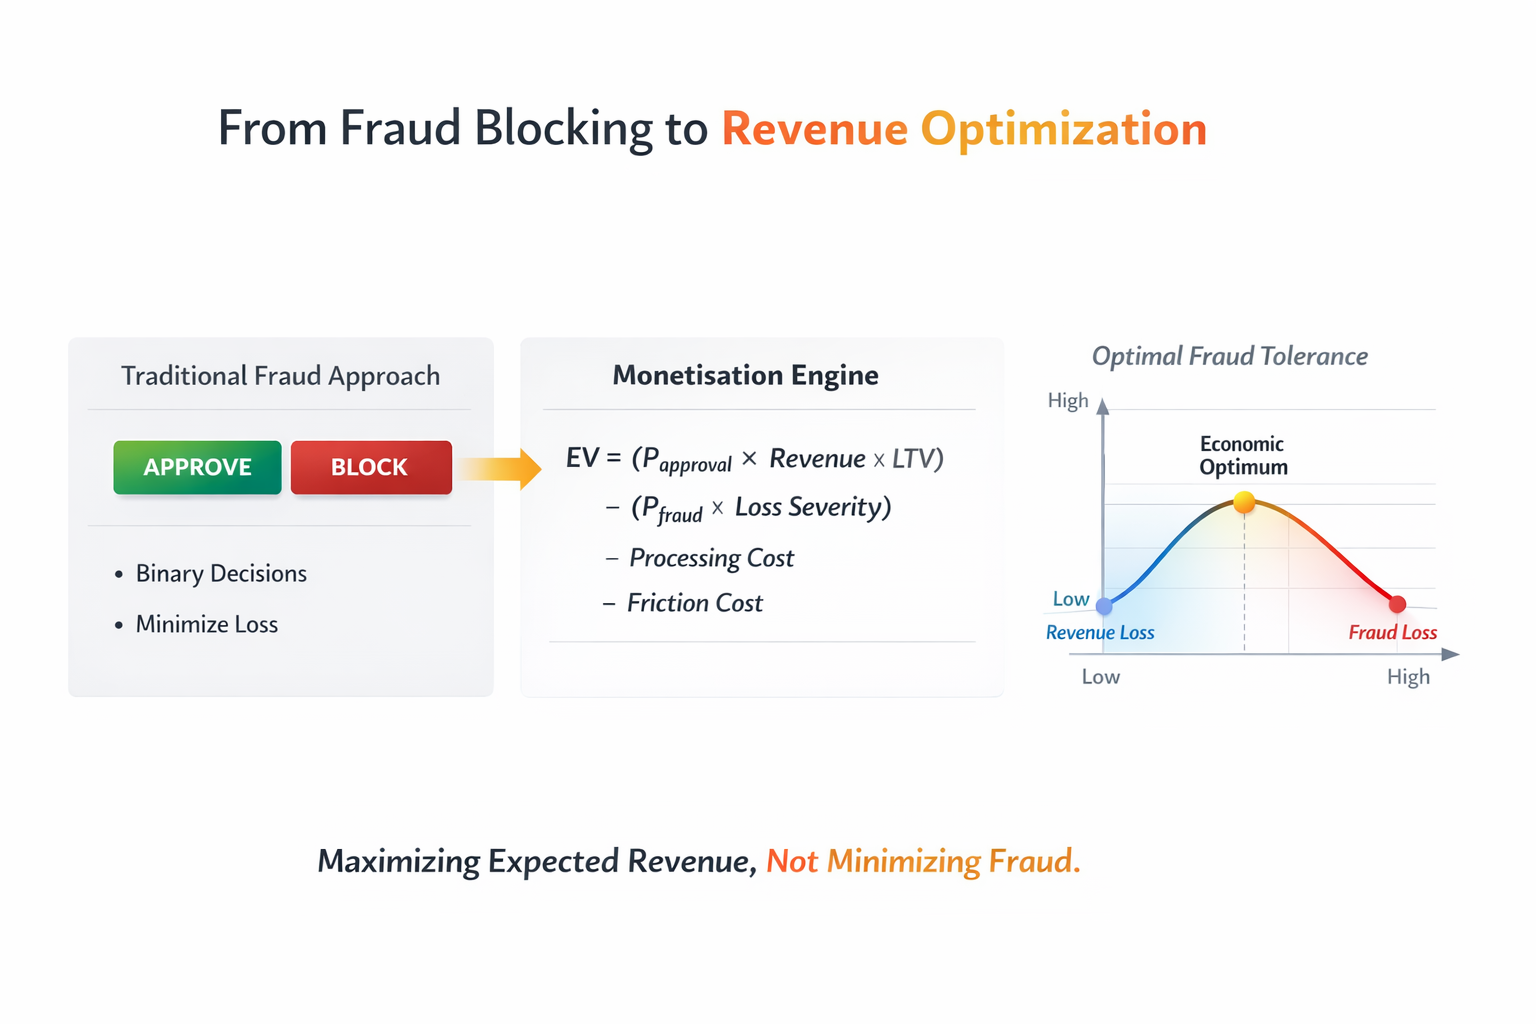
Historically, fraud systems have been built to minimize loss.
That leads to a binary mindset — approve or block.
But zero fraud is not the optimal outcome. The optimal outcome is maximum expected revenue.
On the right, you see our equation. We explicitly model approval probability, fraud loss severity, processing cost, and friction cost.
When you graph fraud tolerance against revenue, you get a convex curve. Block too aggressively and revenue collapses. Be too permissive and fraud erodes margin.
Our system continuously finds and maintains the economic optimum.
This reframing — from fraud minimization to revenue maximization — is the core conceptual shift.
3. Predictive Intelligence Flywheel
“The Compounding Advantage”
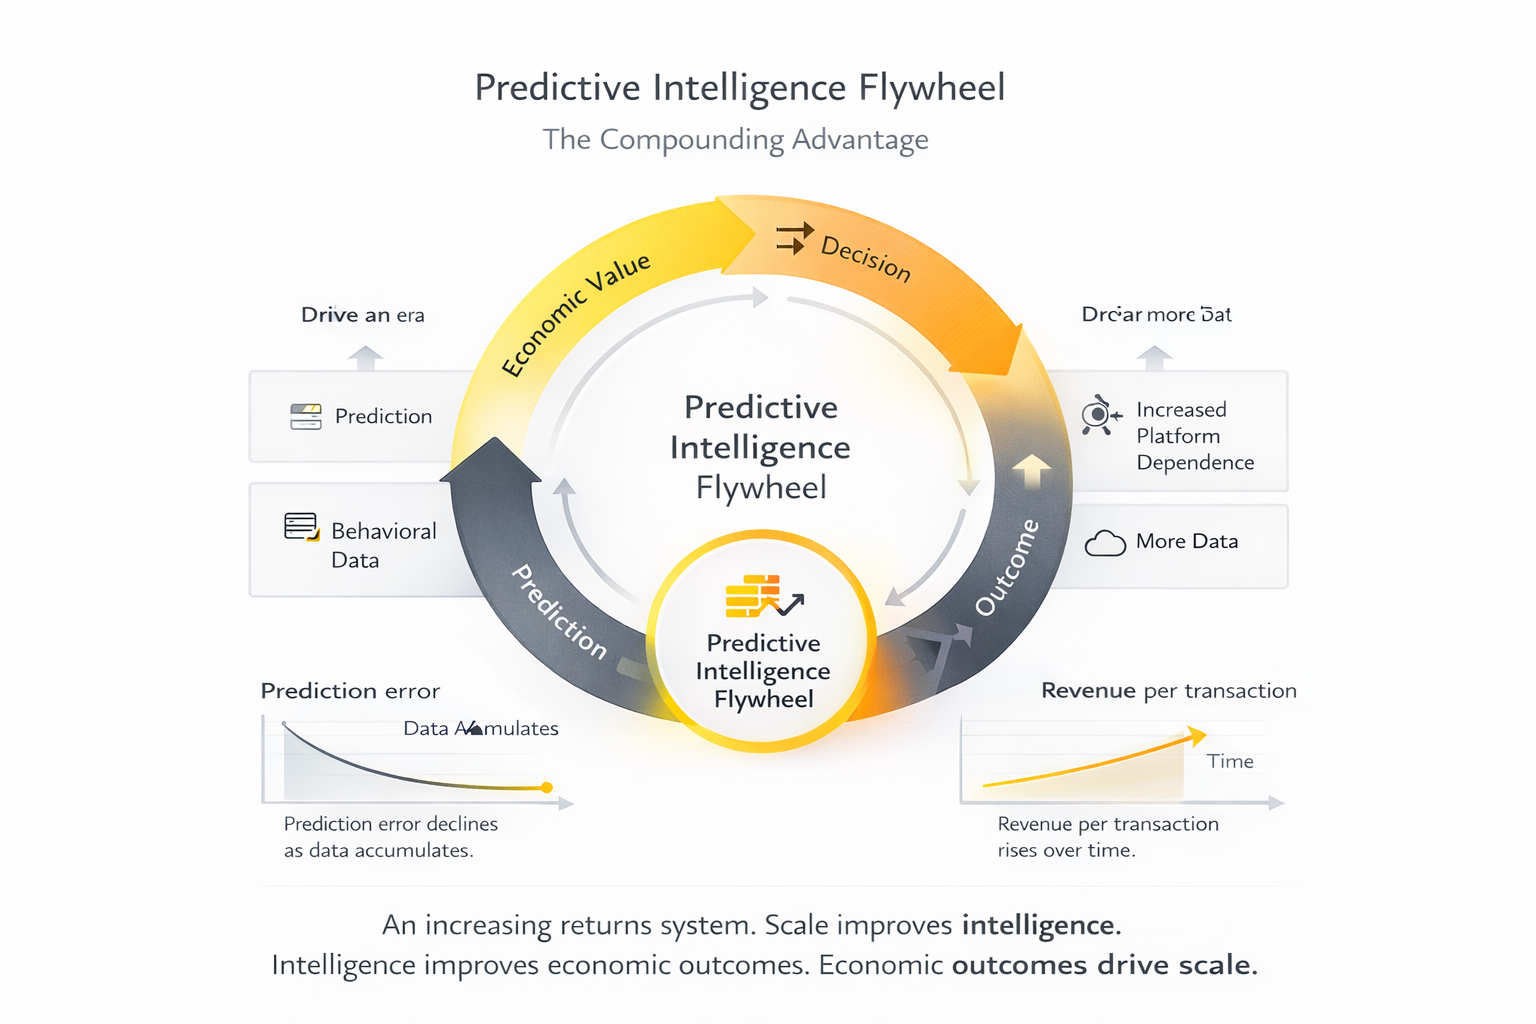
This diagram represents the compounding mechanism.
We collect behavioral data. That data improves prediction quality. Better predictions improve routing and threshold decisions. That increases economic value. Increased value drives higher transaction volume and deeper platform dependence. That generates more data.
This is a closed loop.
Prediction error declines as data accumulates. Revenue per transaction rises over time.
The insight here is that this is an increasing returns system. Scale improves intelligence. Intelligence improves economic outcomes. Economic outcomes drive scale.
4. Real-Time Decision Flow
“Inside a 100 Millisecond Transaction”
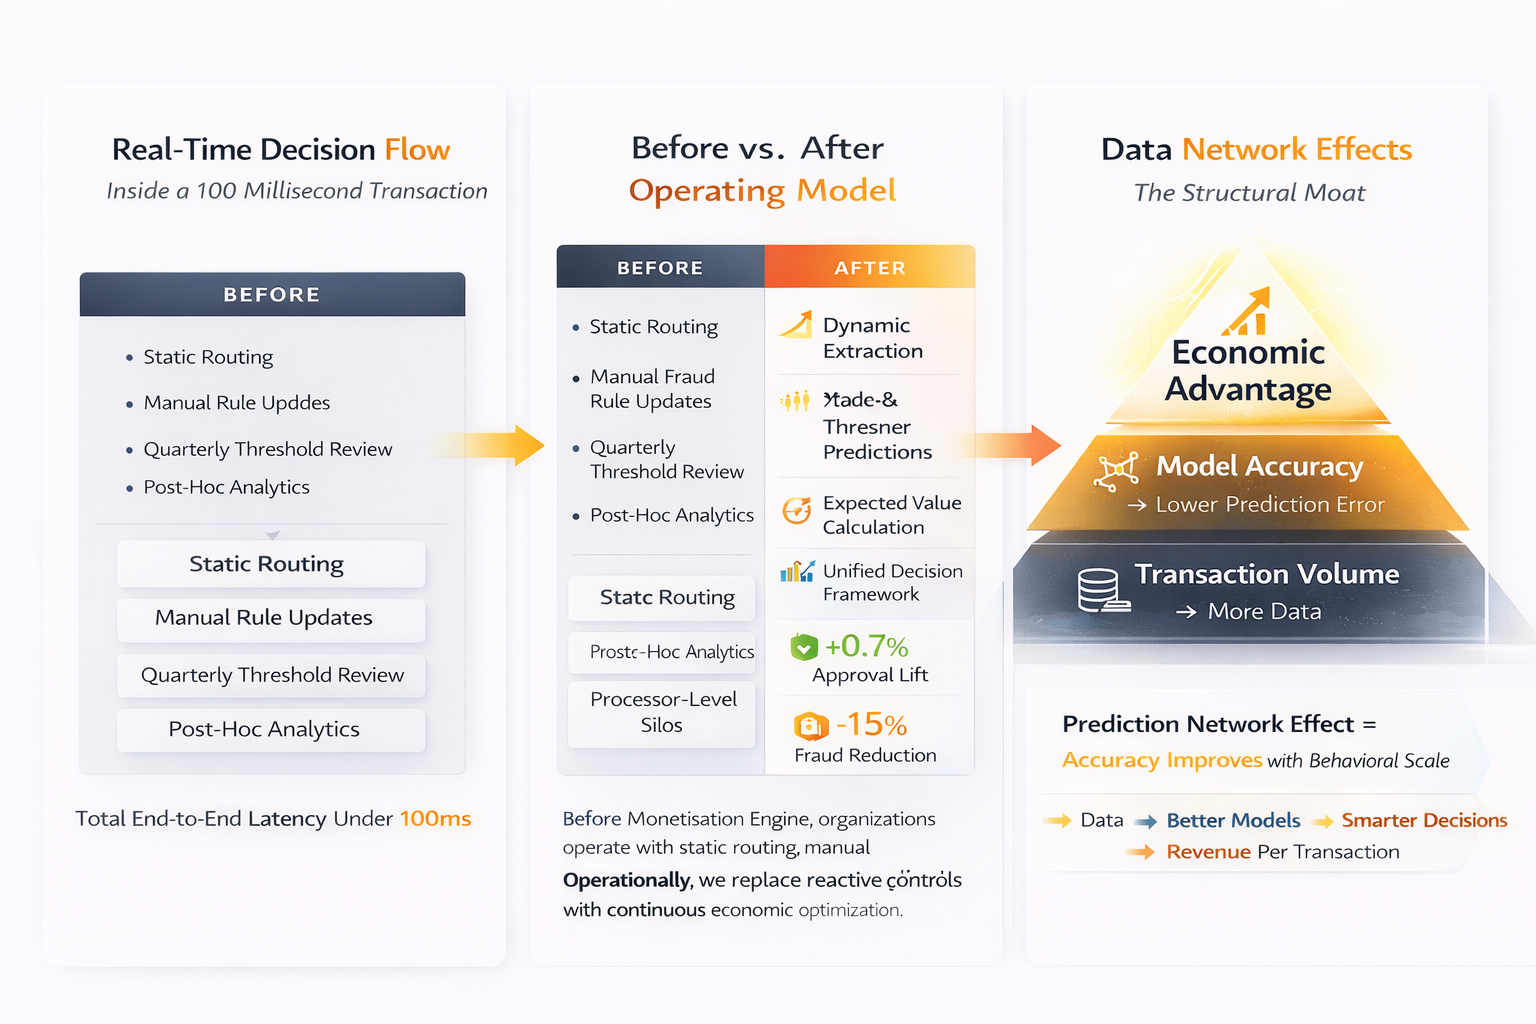
This slide shows what happens operationally.
A transaction is initiated. Features are extracted within milliseconds. Fraud and approval probabilities are computed. Expected value is calculated. A routing decision is selected. The processor authorizes.
All within 100 milliseconds.
The outcome — approval or fraud realization — feeds back into the model training pipeline.
The user never experiences latency. The intelligence layer is invisible, but economically active.
5. Before vs After Operating Model
Before Monetisation Engine, organizations operate with static routing, manual rule updates, and quarterly fraud threshold reviews.
Fraud, payments, and growth teams operate in silos.
After implementation, routing is dynamic. Thresholds self-adjust. Experimentation is continuous. Decisions are unified under a single expected value framework.
The measurable impact is visible: approval lift, fraud reduction, margin expansion.
Operationally, we replace reactive controls with continuous economic optimization.
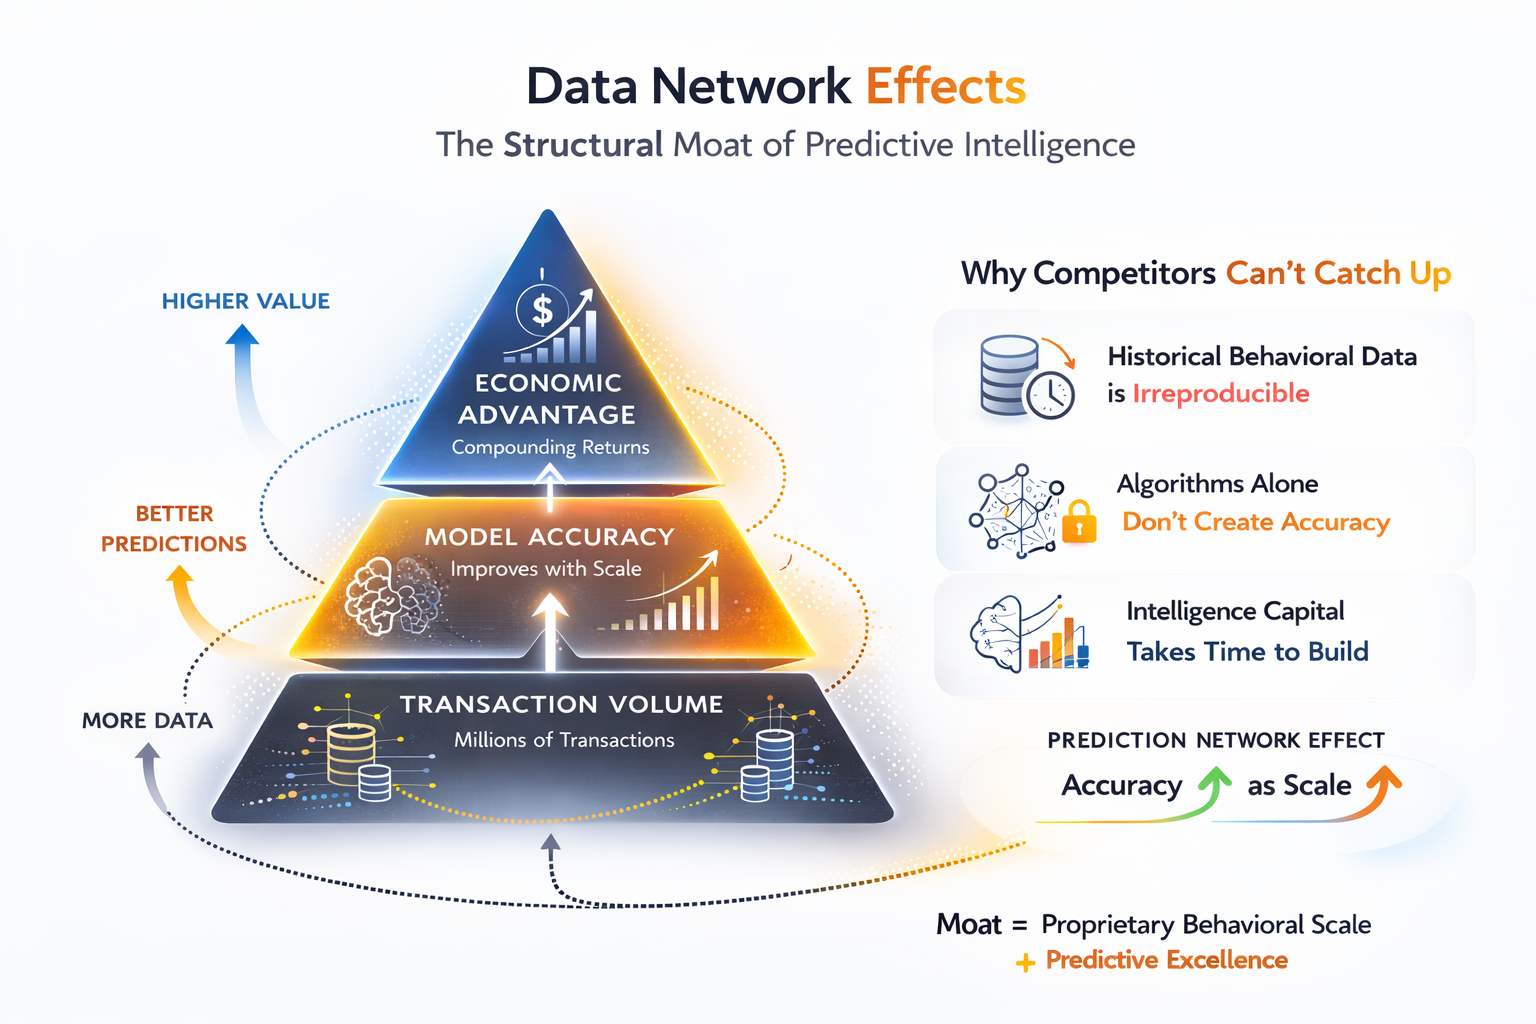
6. Data Network Effects
This pyramid illustrates the structural moat.
At the base is transaction volume. As volume grows, model accuracy improves. As model accuracy improves, economic advantage increases.
Competitors cannot recreate historical behavioral data.
Even if they replicate our algorithms, they lack accumulated intelligence capital.
This is a prediction network effect. It is not about user-to-user interaction. It is about accuracy improving with proprietary behavioral scale.
7. Autonomous Optimization Roadmap
This timeline shows the evolution.
Year one focuses on real-time expected value optimization.
Year two introduces cross-merchant learning and bandit experimentation.
Year three implements reinforcement learning and proactive forecasting.
Year four moves toward autonomous policy management.
The trajectory is clear: from decision support to autonomous economic control.
8. Intelligence Capital
Traditional firms accumulate physical capital.
Our clients accumulate intelligence capital.
This includes model quality, historical data, prediction accuracy, and decision uplift.
Over time, this intelligence capital compounds. Prediction error declines. Revenue per transaction increases.
The system becomes economically stronger with age.
This is a new asset class — accumulated predictive advantage.
9. ICP Economic Leverage
This matrix identifies where the system generates the highest leverage.
The upper-right quadrant — high transaction volume and high decision uncertainty — is ideal.
Companies like Uber, Airbnb, Spotify, and Stripe operate in environments where marginal improvements scale dramatically.
A 0.5 percent lift in approval rate can translate into millions in incremental revenue.
This is where predictive intelligence has multiplicative economic impact.
10. Competitive Positioning
This grid shows category positioning.
Traditional tools focus on fraud prevention. Payment orchestrators focus on routing.
Monetisation Engine operates in a different quadrant — autonomous economic intelligence.
We are not minimizing fraud. We are optimizing expected value.
That creates a new category: Economic Decision Intelligence.
11. Results & Impact
These are typical impact metrics.
Approval rate lift between 0.5 and 1.2 percent. Fraud reduction between 10 and 20 percent. Margin expansion. Processor cost optimization.
Because these improvements apply across millions of transactions, small basis point improvements produce outsized financial impact.
The compounding effect becomes visible over 24 months as revenue per transaction increases steadily.
12. Executive Insight
I’ll close with three insights.
First, fraud prevention and revenue optimization are the same economic problem.
Second, prediction quality compounds with scale. Intelligence becomes a structural asset.
Third, firms that systematically improve decision quality will dominate high-frequency transaction markets.
Monetisation Engine transforms payments infrastructure into economic intelligence infrastructure.
That is the strategic shift.