Azoma - Get your brand recommended by AI Agents
1. From SEO to AI Answer Optimization
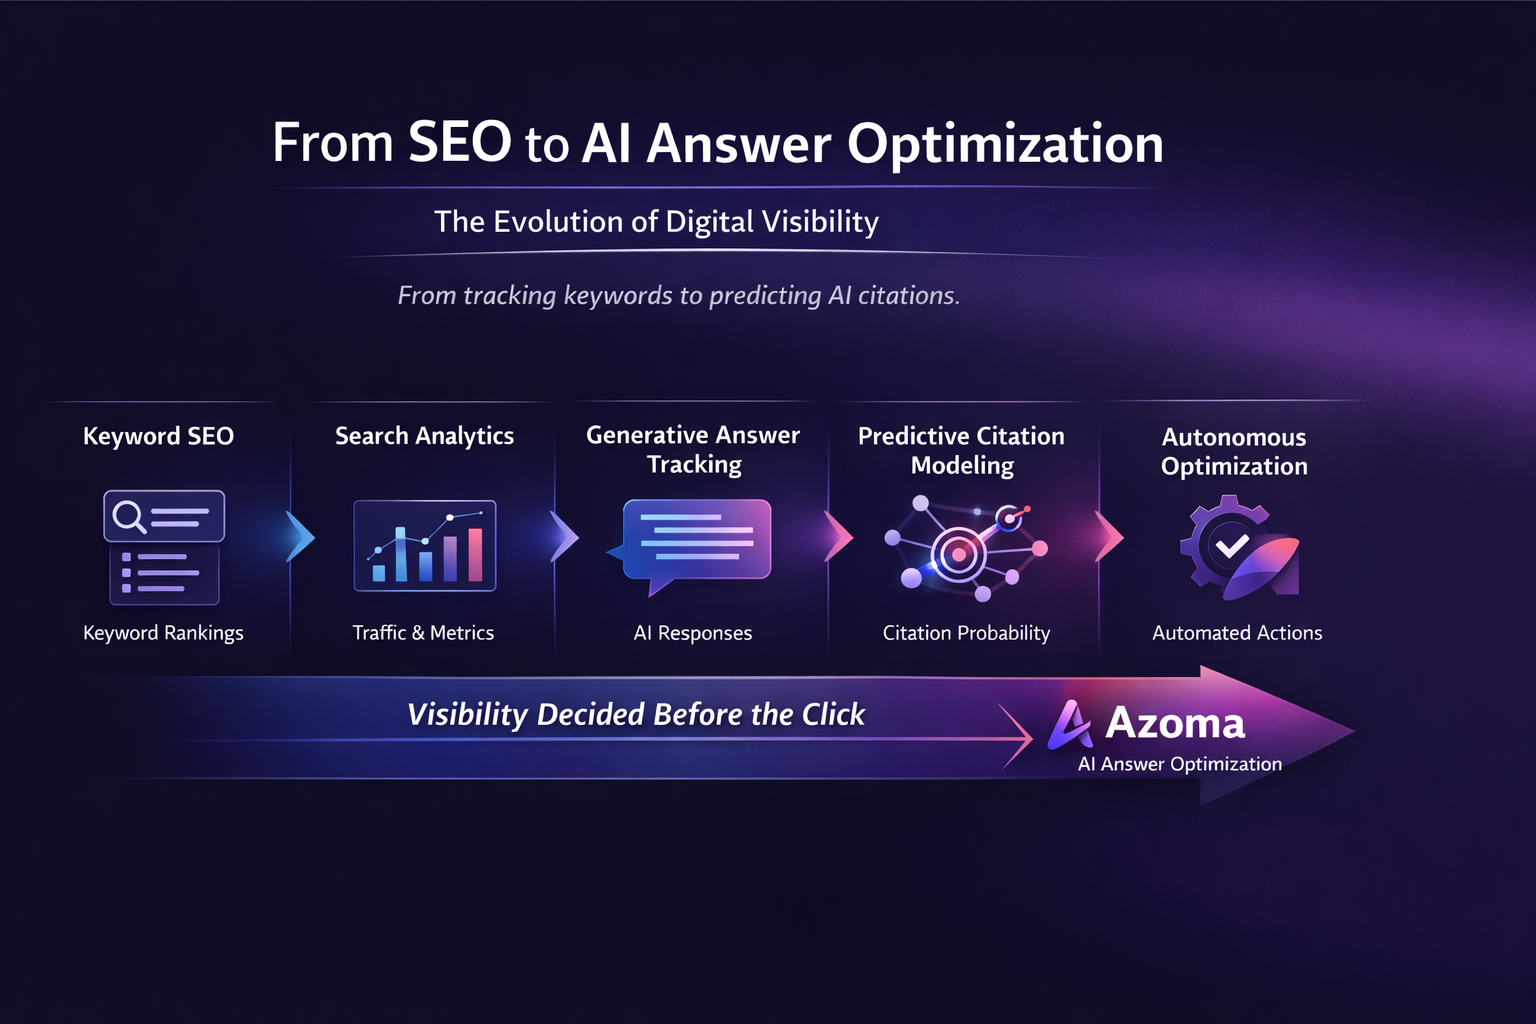
“Historically, brands optimized for keyword rankings in traditional search engines. That worked when discovery meant clicking links. But in generative AI systems, users don’t see ten blue links—they see synthesized answers.
This infographic shows the evolution from keyword SEO to AI answer optimization. Instead of tracking page position, we now model citation probability inside AI-generated responses.
The key shift is upstream. Visibility is decided before the click. If your brand isn’t selected into the answer, you don’t exist in that interaction. Azoma helps brands optimize for inclusion, not just ranking.”
2. The AI Answer Economy
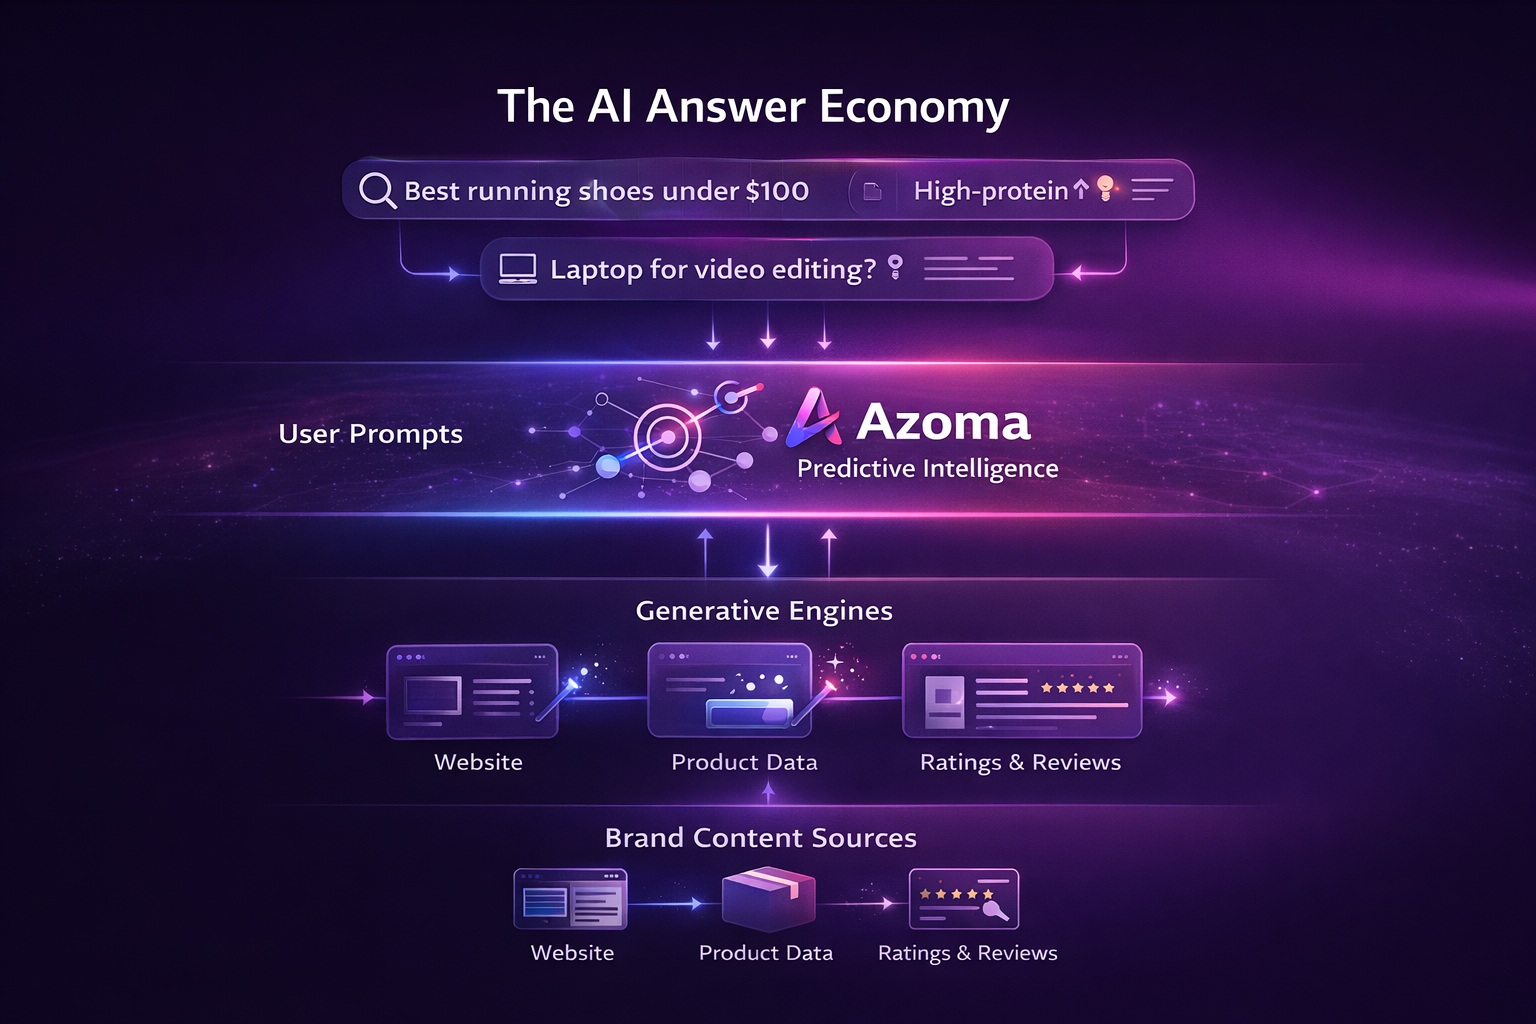
“This diagram shows the emerging AI answer economy. At the top are user prompts. In the middle are generative engines. At the bottom are brand content sources.
What’s missing in most stacks is an intelligence layer connecting brand content to AI engine selection logic. That’s where Azoma operates.
We observe how prompts map to answers, extract citation patterns, and model the structural features that influence inclusion.
Brands need a system that understands how AI engines select sources—not just how search engines rank pages.”
3. The Predictive Intelligence Flywheel
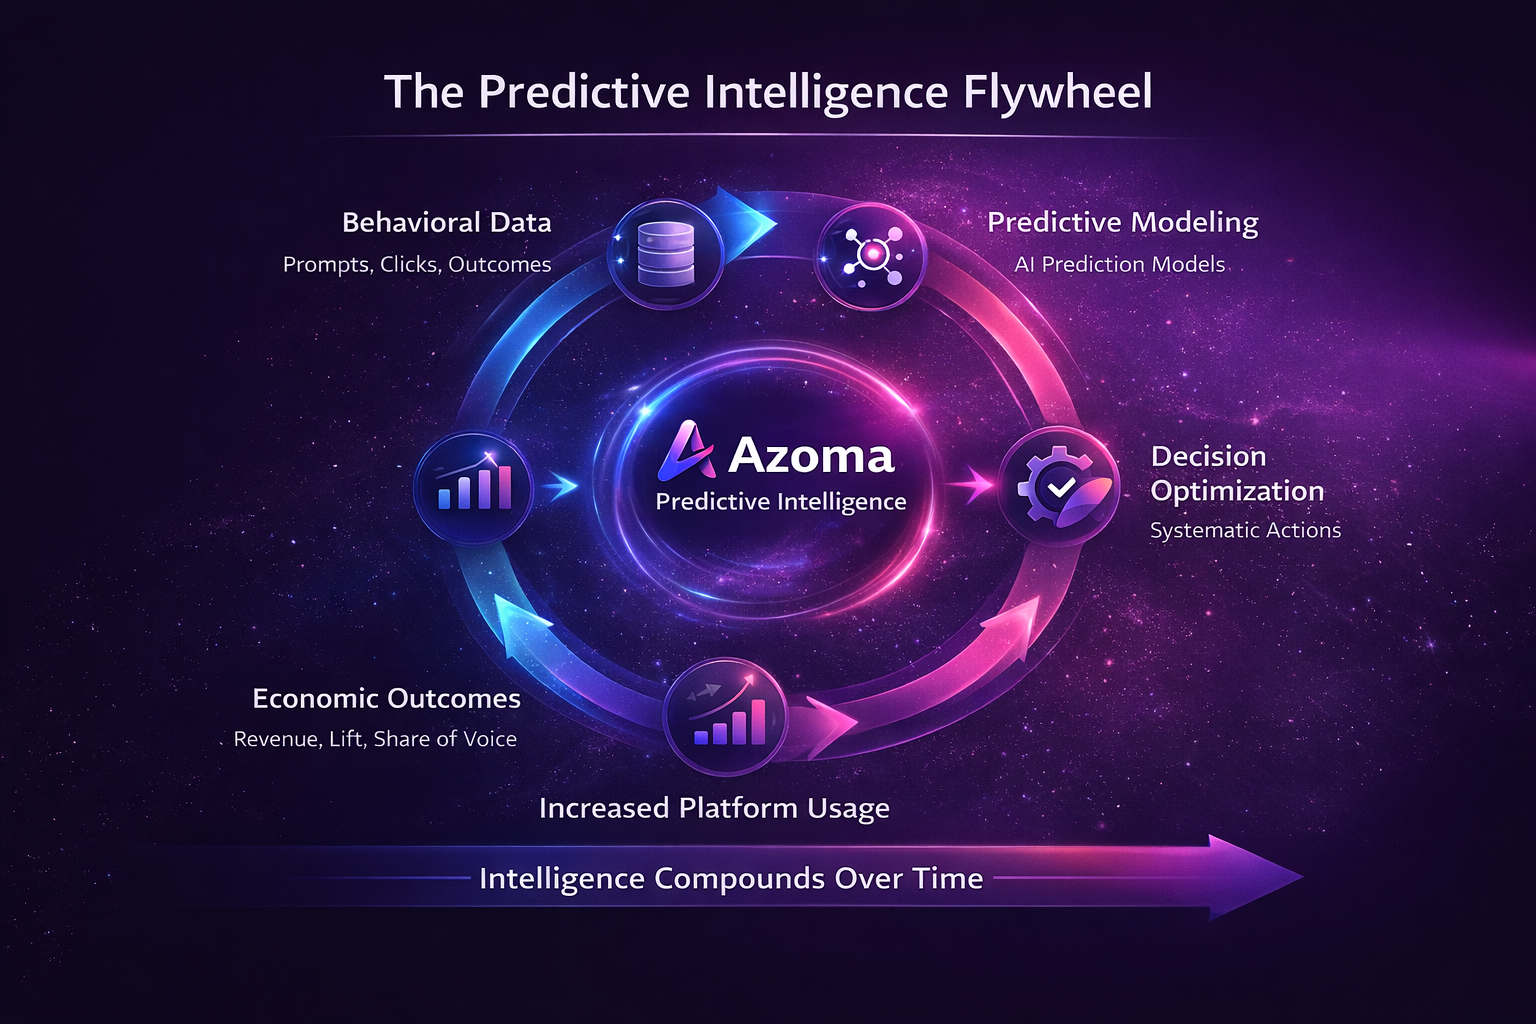
“This is the core of our architecture: the Predictive Intelligence Flywheel.
Behavioral data feeds predictive models. Predictions inform optimization decisions. Those decisions improve economic outcomes. Improved outcomes increase platform usage, which generates more data.
Each loop strengthens model accuracy. Unlike traditional analytics tools, this system compounds intelligence over time.
The more brands use it, the more predictive power it accumulates.”
4. Descriptive vs Predictive vs Prescriptive vs Autonomous
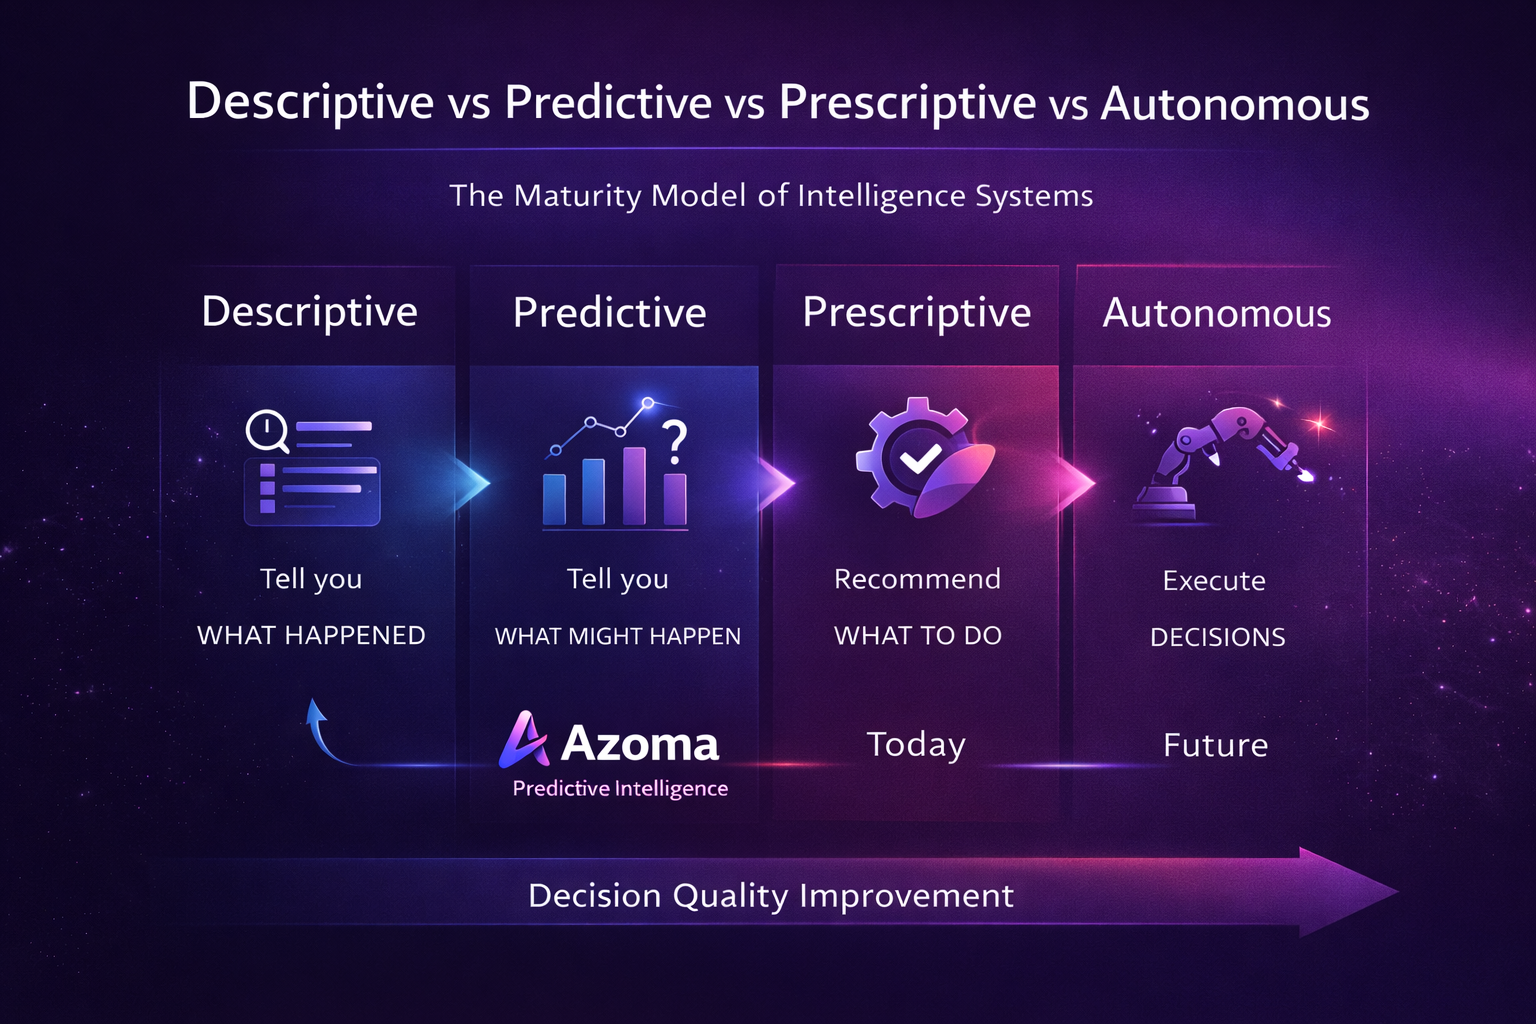
“This maturity model shows four levels of intelligence systems.
Descriptive systems tell you what happened. Predictive systems tell you what might happen. Prescriptive systems recommend what to do. Autonomous systems execute decisions.
Most AI tracking tools stop at descriptive analytics. Azoma operates in the predictive and prescriptive layers today, with a roadmap toward autonomous optimization.
The goal is not reporting. It’s decision quality improvement.”
5. AI Citation Probability Model Explained
“This infographic breaks down how citation likelihood is modeled.
We feed structured data completeness, content attributes, prompt clusters, competitive presence, and historical citation rates into our models.
The output is a citation probability score for specific prompts.
Instead of guessing whether content changes will help, brands see probabilistic forecasts of inclusion. That transforms optimization from intuition to statistical modeling.”
6. Citation Volatility Heatmap
“This heatmap shows how citation inclusion changes across prompt clusters over time.
Generative engines evolve. Answers shift. Competitors move.
Without visibility into volatility, brands optimize blindly.
Azoma surfaces instability and trend emergence so teams can act before losses compound.”
7. Content Elasticity Map
“Not all content changes produce equal impact.
This map shows which attributes or structural improvements most influence citation likelihood.
Some changes have minimal effect. Others produce significant inclusion lift.
We use historical data to estimate elasticity so brands prioritize high-leverage optimizations.”
8. Brand Visibility Scoring Framework
“This framework shows how we quantify AI visibility.
It combines citation frequency, rank weighting, prompt coverage breadth, competitive displacement, and conversion attribution.
Visibility is multi-dimensional. A single metric is insufficient.
Our scoring system gives brands a measurable AI visibility index across generative engines.”
9. AI Visibility to Revenue Attribution Model
“This funnel connects AI visibility directly to revenue.
Prompt leads to citation. Citation influences engagement. Engagement drives conversion. Conversion generates revenue.
By modeling the relationship between citation probability and conversion uplift, we quantify the economic value of answer inclusion.
Visibility becomes a financial lever, not just a marketing metric.”
10. Competitive Displacement Model
“This radar chart compares your brand to competitors across structural and visibility metrics.
Prompt coverage, citation share, schema depth, content authority, and structural completeness are evaluated side by side.
The goal is not generic benchmarking. It’s identifying structural asymmetries that create competitive vulnerability or advantage.”
11. Generative Engine Monitoring Architecture
“This system diagram explains how we ingest and version AI responses.
We capture prompt-response pairs, extract citations, normalize entities, and store time-series variations.
This creates longitudinal data that powers predictive modeling.
Tracking generative engines requires infrastructure, not just scraping outputs.”
12. The AI Commerce Stack
“This stack visualizes where Azoma sits in the AI commerce ecosystem.
User prompts sit at the top. Generative engines synthesize answers. Brand content lives below.
Azoma acts as the intelligence layer aligning brand structure with engine selection logic.
We are not replacing engines—we are optimizing for them.”
13. The Intelligence Moat Framework
“This diagram shows the four structural moats created by predictive intelligence.
First, proprietary behavioral data.
Second, compounding model advantage.
Third, switching costs through decision dependency.
Fourth, deep integration into brand workflows.
Competitive defensibility in AI markets comes from intelligence accumulation, not just features.”
14. SEO vs AI Answer Optimization Comparison
“This side-by-side comparison clarifies the paradigm shift.
SEO focuses on page ranking and backlinks. AI answer optimization focuses on inclusion probability and structured knowledge graphs.
The optimization surface has changed.
Brands that treat generative systems like traditional search will underperform.”
15. The Decision Infrastructure Model
“This diagram shows how predictions feed directly into prioritized action queues.
Instead of dashboards alone, the system ranks opportunities by expected revenue impact.
Decision infrastructure replaces reactive analysis.
This is how intelligence platforms create economic value.”
16. Prompt-to-Answer Lifecycle Map
“This flow shows how visibility is decided before users click anything.
Prompt triggers retrieval. Retrieval triggers content selection. Selection determines citation inclusion and rank ordering.
Brands must optimize for this lifecycle.
The battle for visibility happens inside the answer generation stage.”
17. AI Visibility Risk Index Dashboard
“This mockup illustrates how risk is surfaced.
We identify high-risk prompt clusters, forecast citation drops, and quantify revenue exposure.
This transforms AI visibility from a passive metric into an actively managed risk category.”
18. Content-to-Citation Feedback Loop
“This circular diagram shows how content updates influence citation shifts, which then influence conversion and retraining.
Every change feeds back into the predictive system.
Optimization becomes continuous rather than episodic.”
19. AI Search as a Dynamic System
“This network graph illustrates prompts, brands, competitors, and engines as nodes in a dynamic ecosystem.
Relationships shift over time.
AI search is not static ranking. It is a fluid knowledge network.
Understanding this graph structure is essential to maintaining visibility.”
20. The Future: Autonomous Brand Optimization
“This roadmap shows the long-term trajectory.
We begin with tracking.
Move to prediction.
Then prescriptive workflows.
Ultimately reach autonomous optimization.
The future of AI-native visibility is self-improving systems that continuously refine brand inclusion without manual intervention.”