GRACE - AI Governance & Observability System
At 2021.ai, the GRACE platform was expanding into regulated industries including finance and healthcare.
However, enterprise customers faced a critical blocker:
Limited visibility into model behavior post-deployment
Manual or reactive drift detection
Insufficient auditability and traceability
Increasing regulatory pressure (e.g., GDPR, EU AI Act)
This wasn’t merely a feature gap.
It was a trust and adoption problem directly impacting enterprise sales cycles and platform expansion.
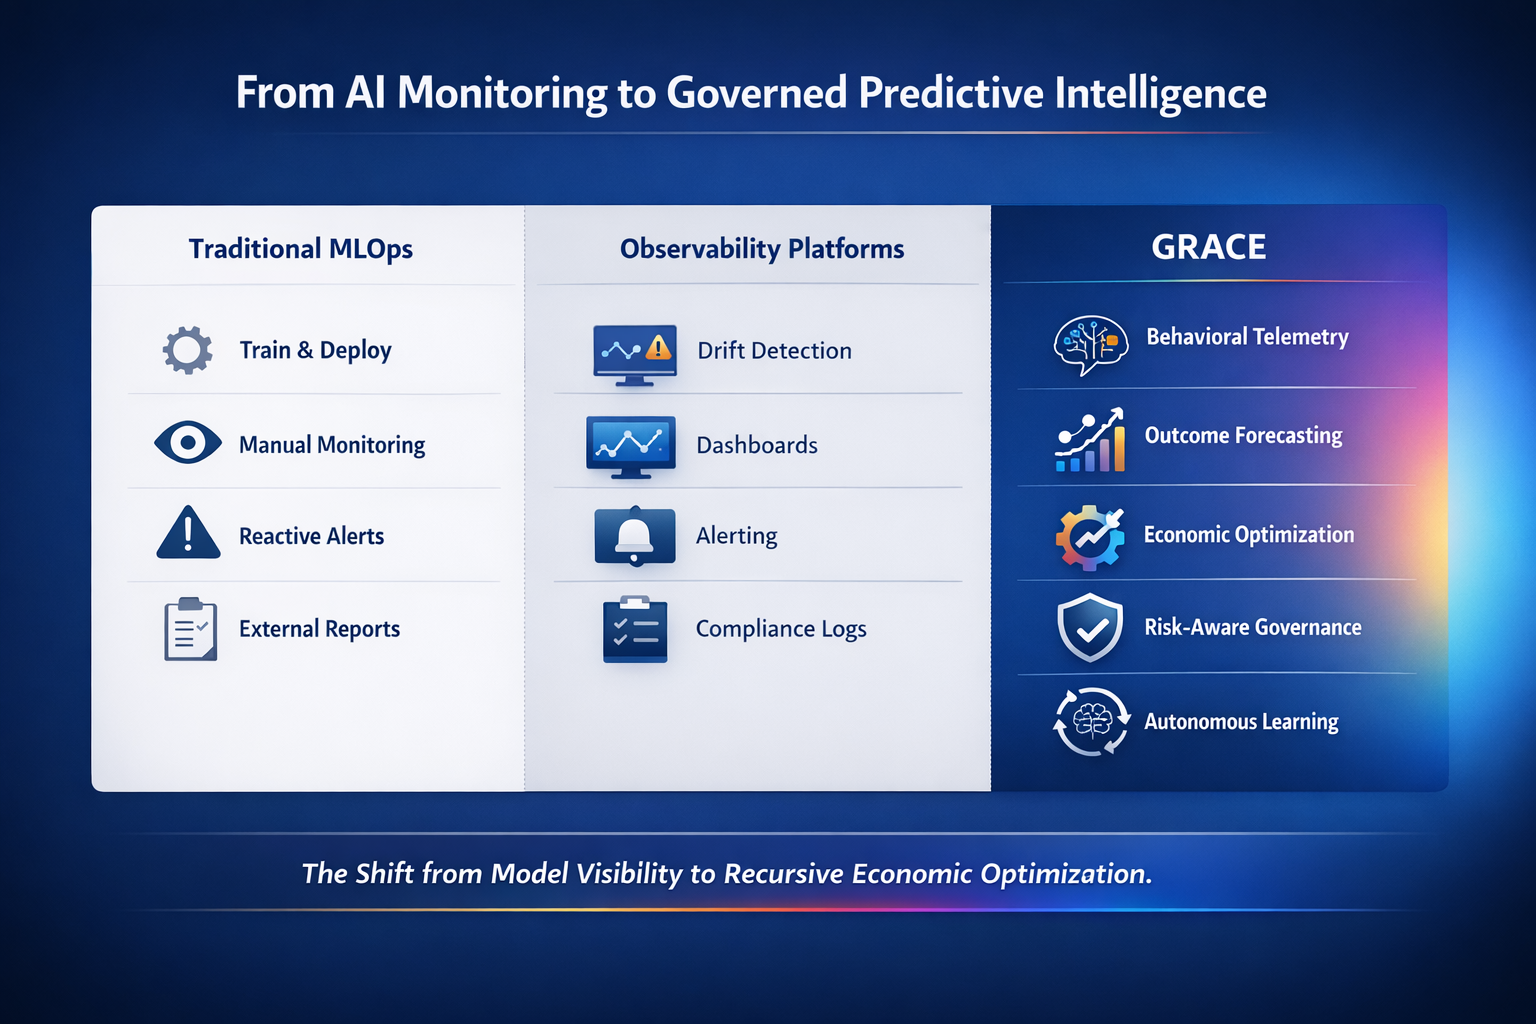
1. From AI Monitoring to Governed Predictive Intelligence
“What you’re looking at here is the evolution of enterprise AI infrastructure.
On the left, we have traditional MLOps. Models are trained, deployed, and manually monitored. Issues are detected reactively. Governance is often external and document-heavy.
In the middle, we see observability platforms. These improve visibility. They detect drift. They generate alerts. They provide dashboards. But they remain fundamentally reactive.
On the right is GRACE.
GRACE shifts the paradigm. Instead of simply detecting problems, it continuously forecasts downstream impact, optimizes decision policies, enforces governance constraints, and learns recursively from outcomes.
The difference is conceptual and economic.
Monitoring protects models.
GRACE improves decisions.
This is a category shift—from model visibility to recursive economic optimization.”
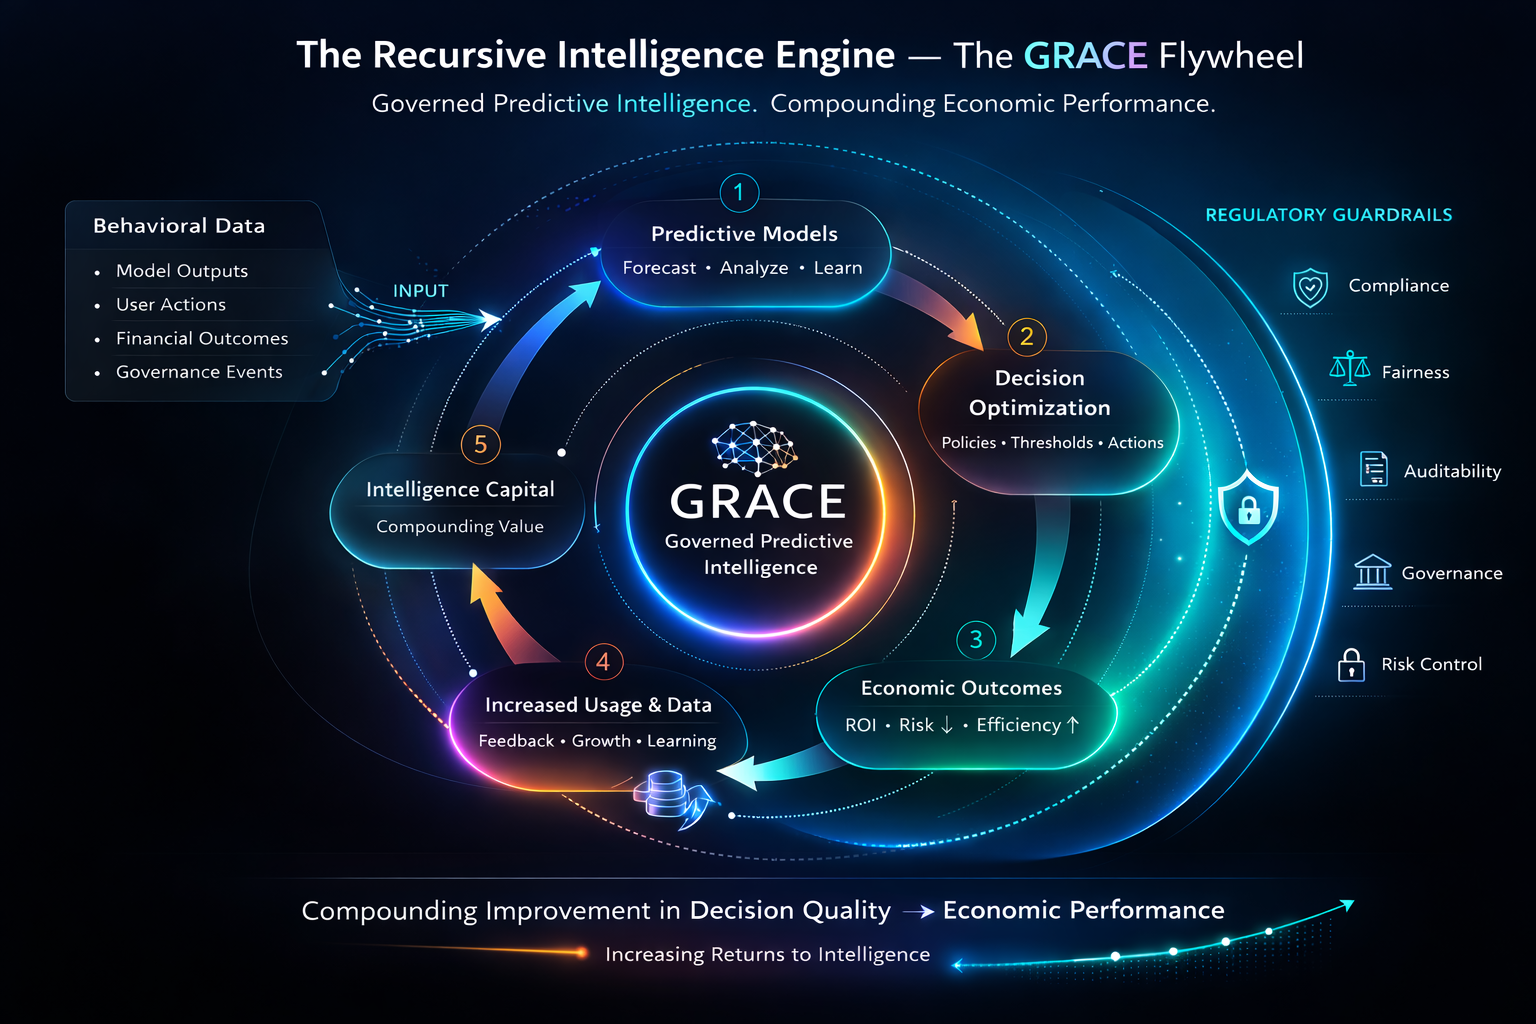
2. The Recursive Intelligence Engine
This diagram represents the core engine of GRACE—the Governed Predictive Intelligence Flywheel.
It starts with behavioral data: model outputs, user actions, financial outcomes, and governance events.
That data feeds predictive models.
Those predictions inform decision optimization.
Optimized decisions improve economic outcomes.
Improved outcomes increase usage and data generation.
The loop reinforces itself.
What makes GRACE unique is that this entire cycle operates inside regulatory guardrails. Governance is not an afterthought. It wraps the system.
The result is compounding improvement in decision quality.
And decision quality directly determines economic performance.
This is increasing returns to intelligence.”
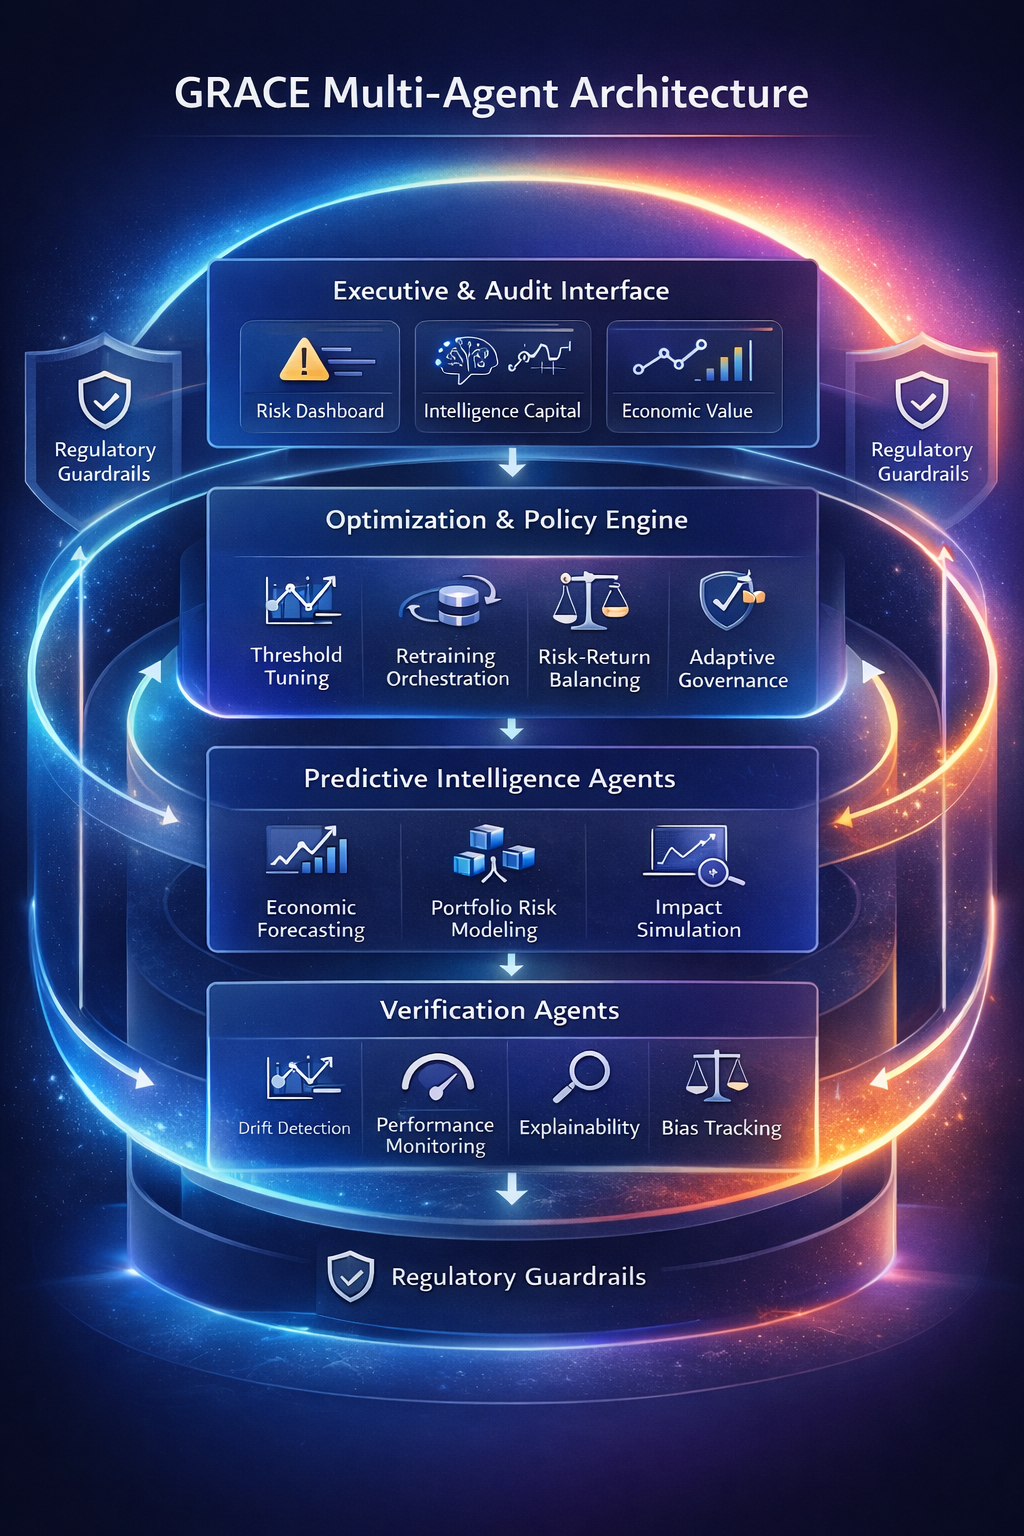
3. GRACE Multi-Agent Architecture
This is the architectural view of the platform.
At the base, we ingest telemetry—predictions, behavior, outcomes, policy interventions.
On top of that sit verification agents: drift detection, performance monitoring, explainability, bias tracking.
Above verification, we introduce predictive intelligence agents. These forecast economic impact, systemic risk, and portfolio instability.
Then comes the optimization engine. It tunes thresholds, retraining cadence, and policy rules—always under compliance constraints.
Finally, at the executive layer, we translate all this into board-level metrics: risk compression, intelligence capital growth, and economic value created.
The key takeaway is that observability is just the first layer.
GRACE integrates verification, prediction, optimization, and governance into one recursive system.”
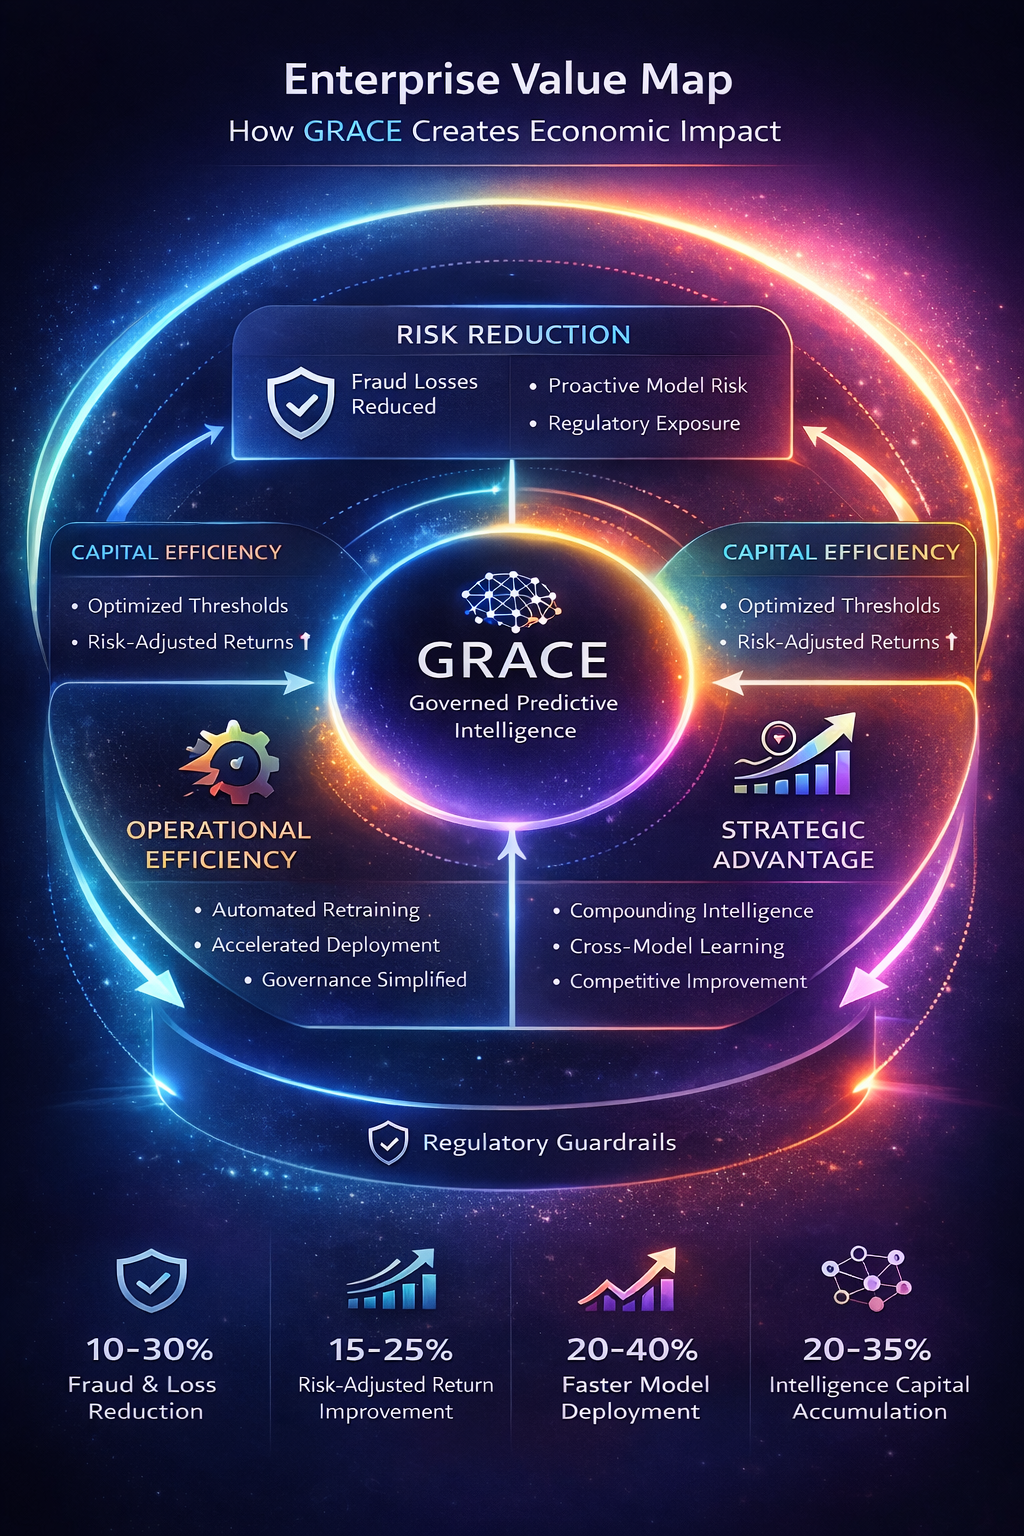
4. Enterprise Value Map
This infographic shows how GRACE creates enterprise value across four dimensions.
First, risk reduction. We reduce fraud losses, model failures, and regulatory exposure.
Second, capital efficiency. By optimizing thresholds and forecasting portfolio risk, we improve risk-adjusted returns and reduce unnecessary capital reserves.
Third, operational efficiency. Automated retraining and governance reduce firefighting and accelerate model deployment.
Fourth, strategic advantage. Intelligence accumulates. Cross-model learning compounds. The system improves over time.
The key point is that GRACE does not improve a single KPI.
It simultaneously impacts revenue, cost, capital, and risk.
That multi-dimensional leverage is what makes the economics powerful.”
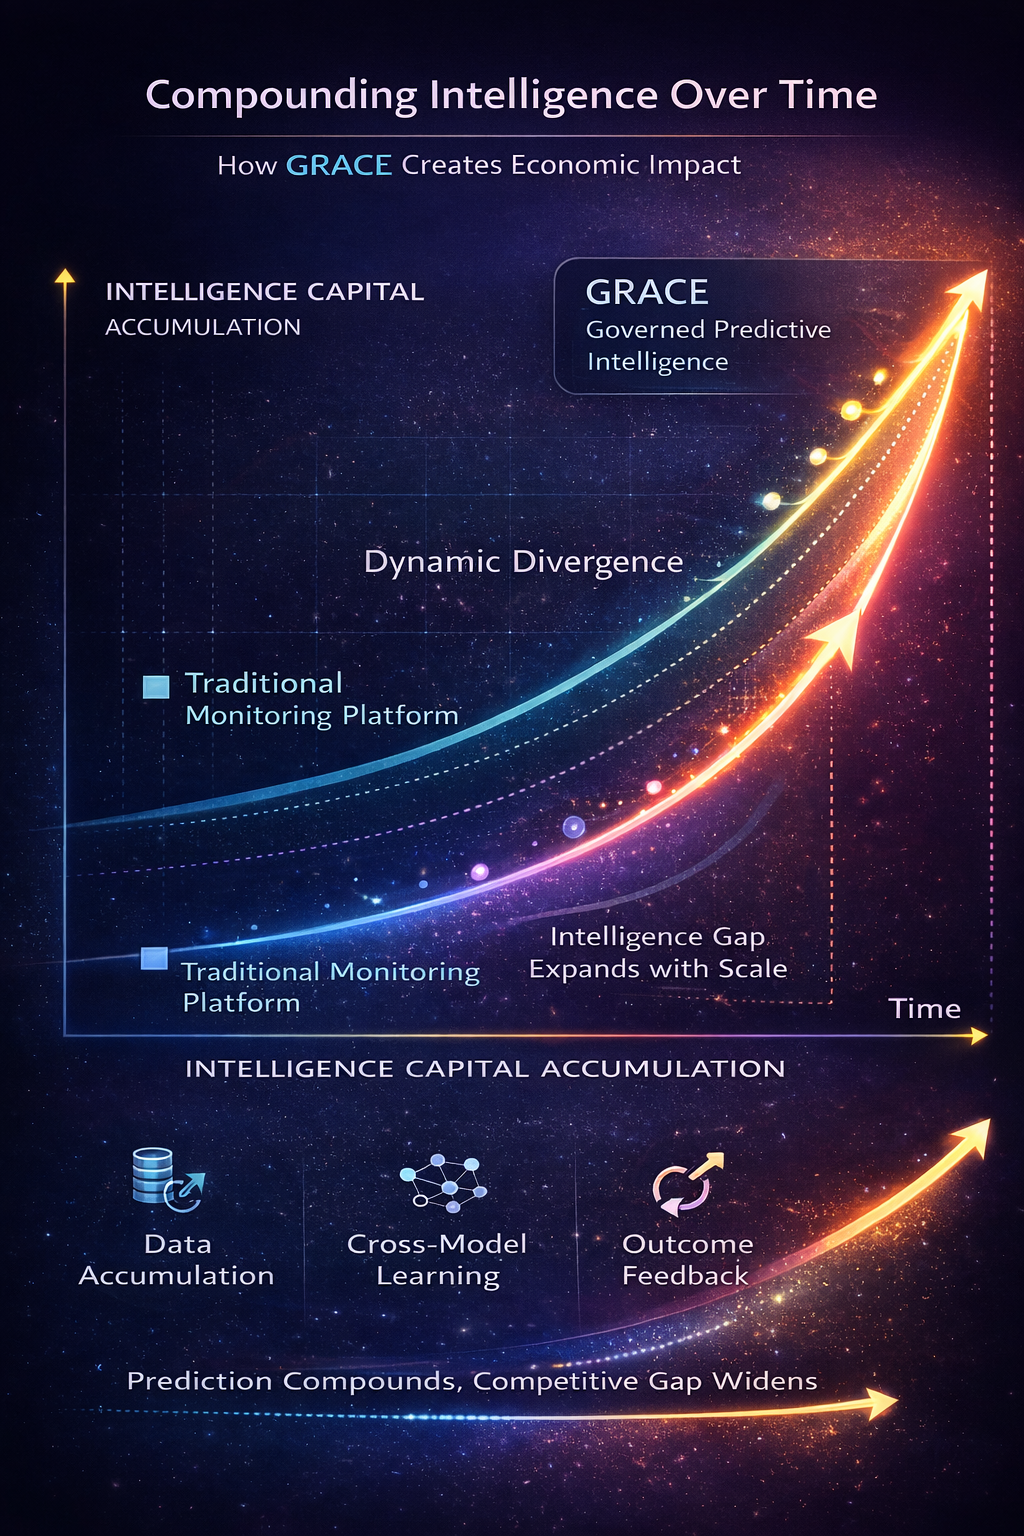
5. Compounding Intelligence Over Time
This chart illustrates intelligence capital accumulation.
A traditional monitoring platform grows linearly. It tracks more models, but its insight per model remains relatively static.
GRACE, by contrast, compounds.
As more data accumulates, prediction quality improves.
Improved predictions optimize decisions.
Better decisions generate more behavioral data.
The slope accelerates.
Over time, switching costs increase because historical intelligence is embedded in the system.
Prediction accuracy widens relative to competitors.
This is a dynamic divergence model.
The intelligence gap expands with scale.”
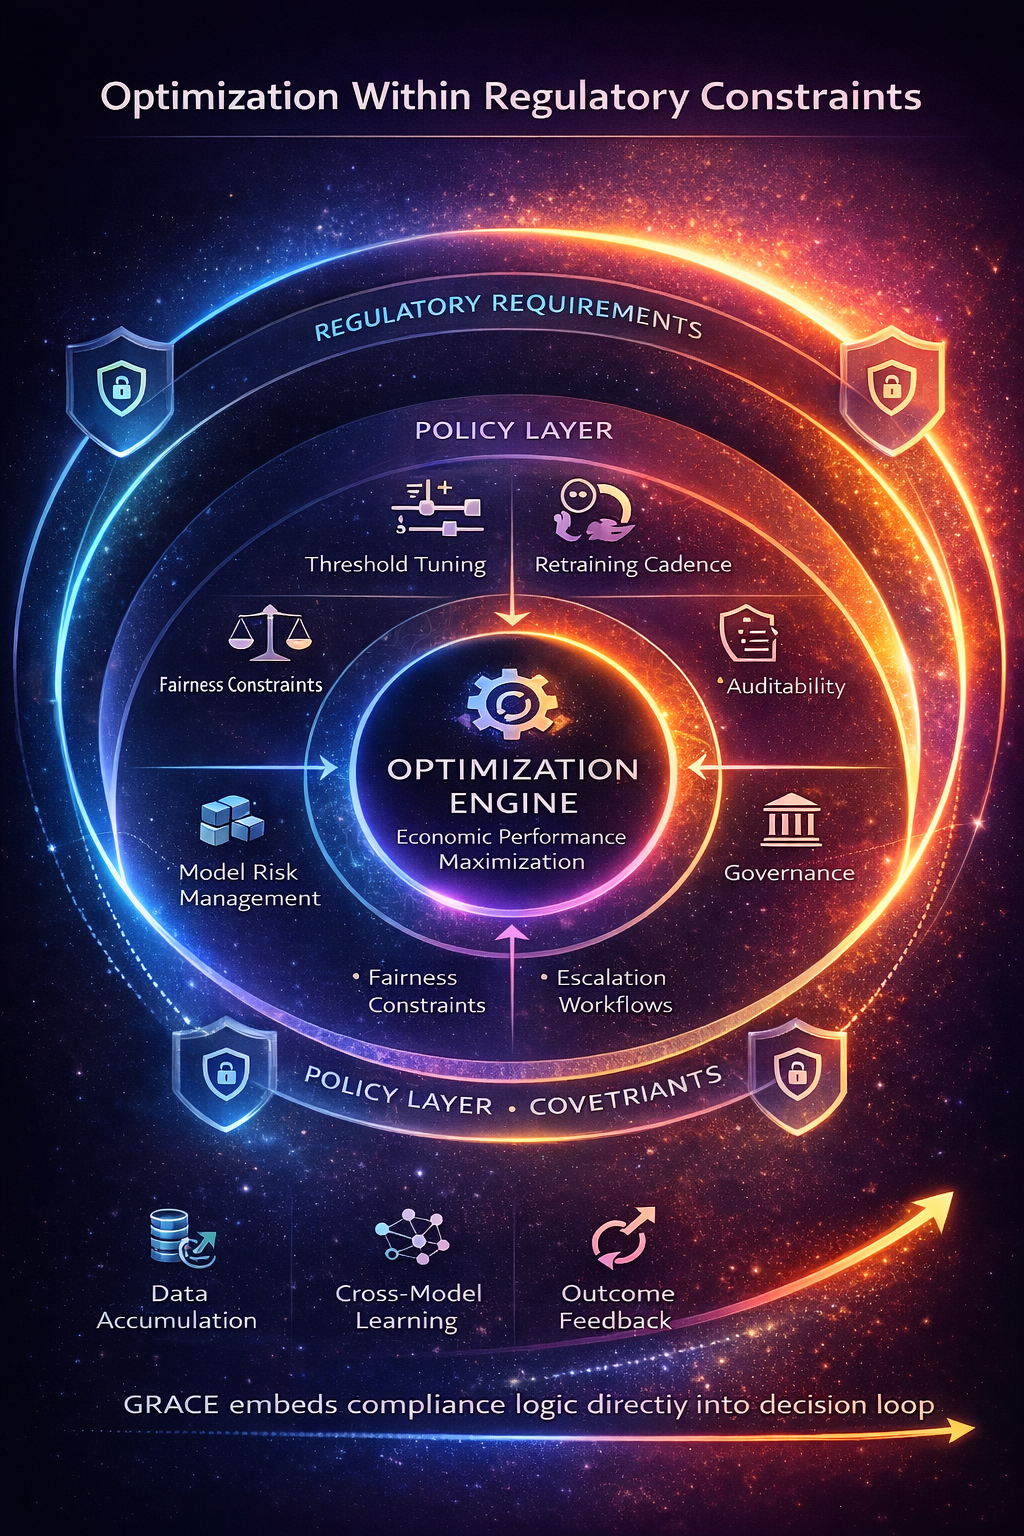
6. Optimization Within Regulatory Constraints
This diagram shows how optimization and governance coexist.
At the core is the optimization engine—maximizing economic performance.
Surrounding it is the policy layer—threshold rules, retraining cadence, fairness constraints.
The outer ring represents regulatory requirements—model risk management, fairness standards, auditability.
GRACE operates within these constraints. It does not optimize blindly.
This is critical in regulated industries.
Unconstrained optimization increases risk.
Governed optimization increases risk-adjusted returns.
GRACE embeds compliance logic directly into the decision loop.”
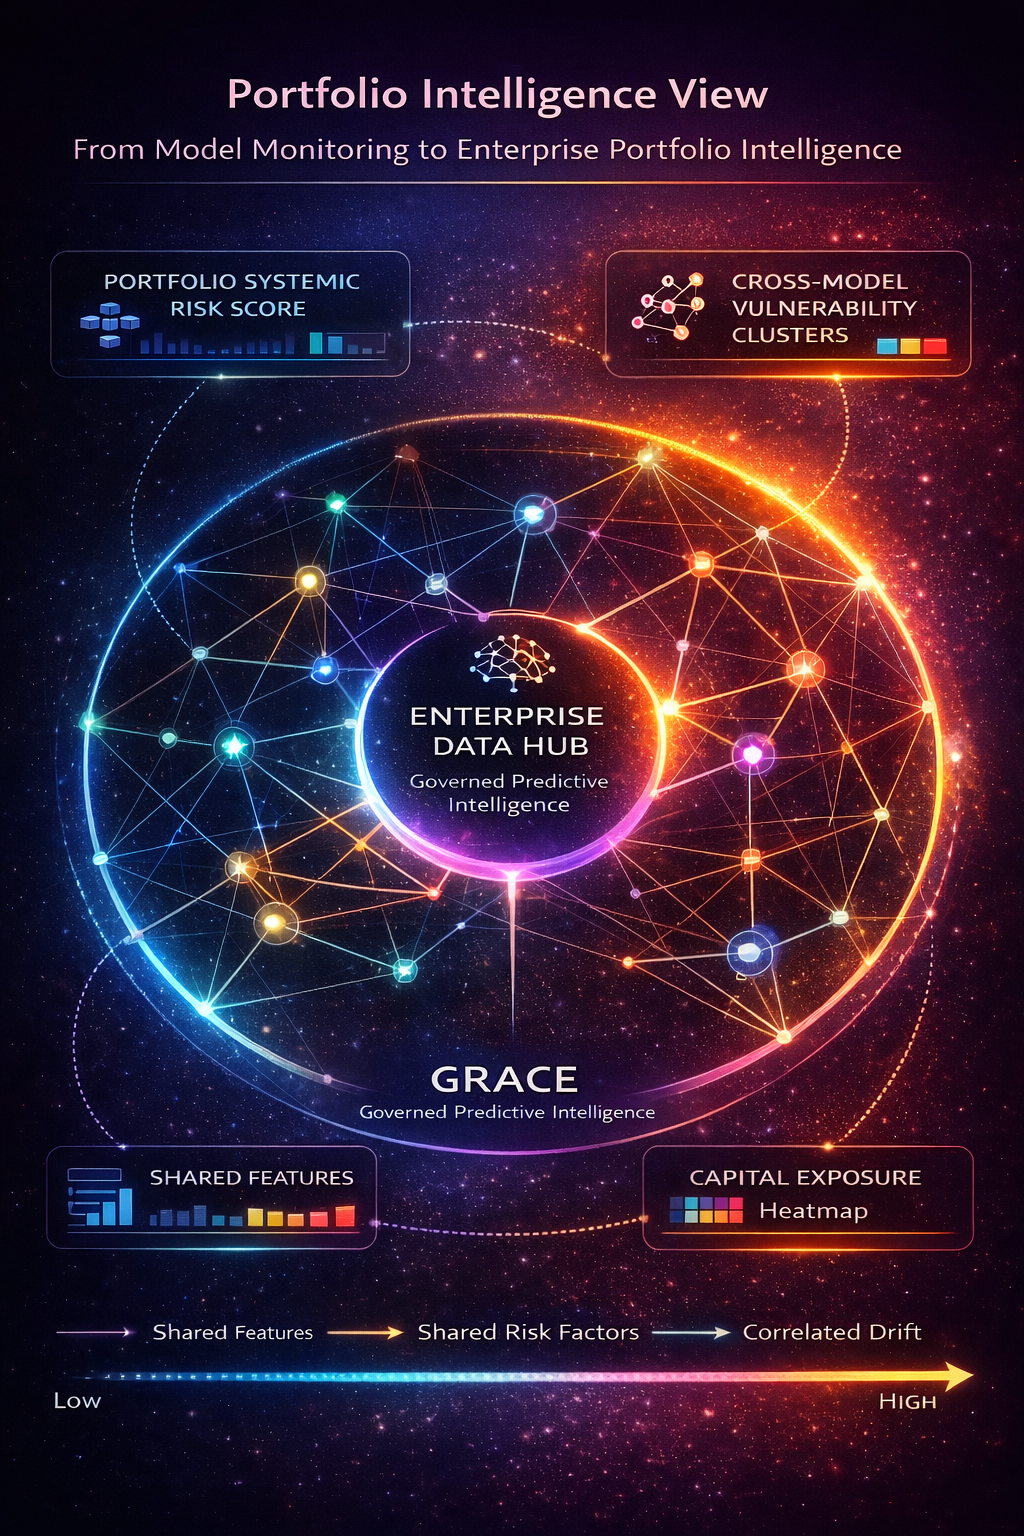
7. Portfolio Intelligence View
This visual represents enterprise AI as a network, not isolated models.
Models share features. They share data sources. They share economic exposure.
GRACE maps these interconnections.
It detects correlated drift.
It identifies systemic bias exposure.
It forecasts portfolio-level instability.
Most platforms monitor models individually.
GRACE monitors the enterprise decision system as a portfolio.
That shift from model-level to system-level intelligence is essential for large enterprises.”
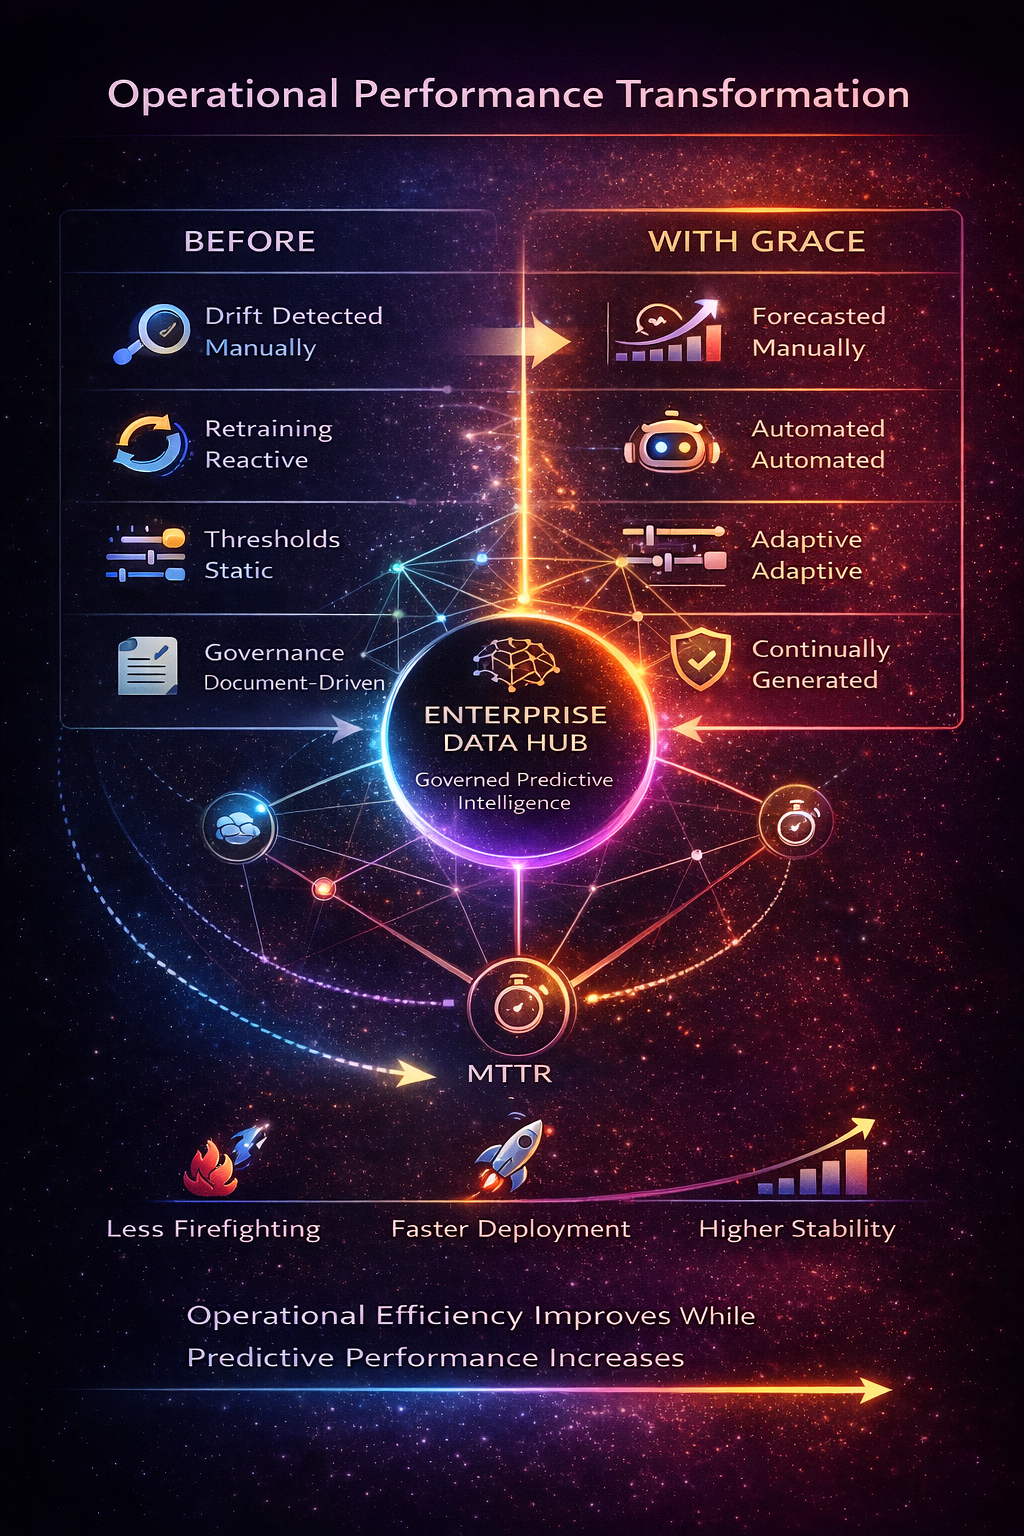
8. Operational Performance Transformation
This infographic compares operations before and after GRACE.
Before: drift is detected manually. Retraining is reactive. Thresholds are static. Governance is document-driven. Incident response is slow.
After: drift is forecasted. Retraining is automated. Thresholds are adaptive. Compliance documentation is continuously generated. MTTR is reduced.
The effect is operational compression.
Less firefighting.
Faster deployment.
Higher stability.
Operational efficiency improves while predictive performance increases.”