The Listening Enterprise: Gaining Operational Advantage by Fixing the System, Not the People
WHY COOs LOSE VISIBILITY AT SCALE
1. The Illusion of Operational Control
In the early stages of a company, the Chief Operating Officer (COO) or head of Operations has near-perfect clarity. They can walk across the floor (physical or virtual), talk to anyone, and instantly understand the status of a critical order, a product launch, or a customer issue. Work is visible, processes are informal but coherent, and decision latency is low.
As the organization scales, a strange and deceptive phenomenon occurs: the illusion of operational control.
Leaders inherently believe they understand how work happens because they built the systems, hired the talent, and approved the documented processes. They are presented with metrics—daily dashboards, weekly reports, quarterly business reviews—that suggest stability and predictability. They see green lights and hitting targets, and they equate this outcome data with successful operational mechanics.
However, these metrics are often the output of the system, not a faithful diagnosis of the system's health. The information they receive is filtered, aggregated, and optimized to reflect success, masking the massive, messy complexity required to produce those results.
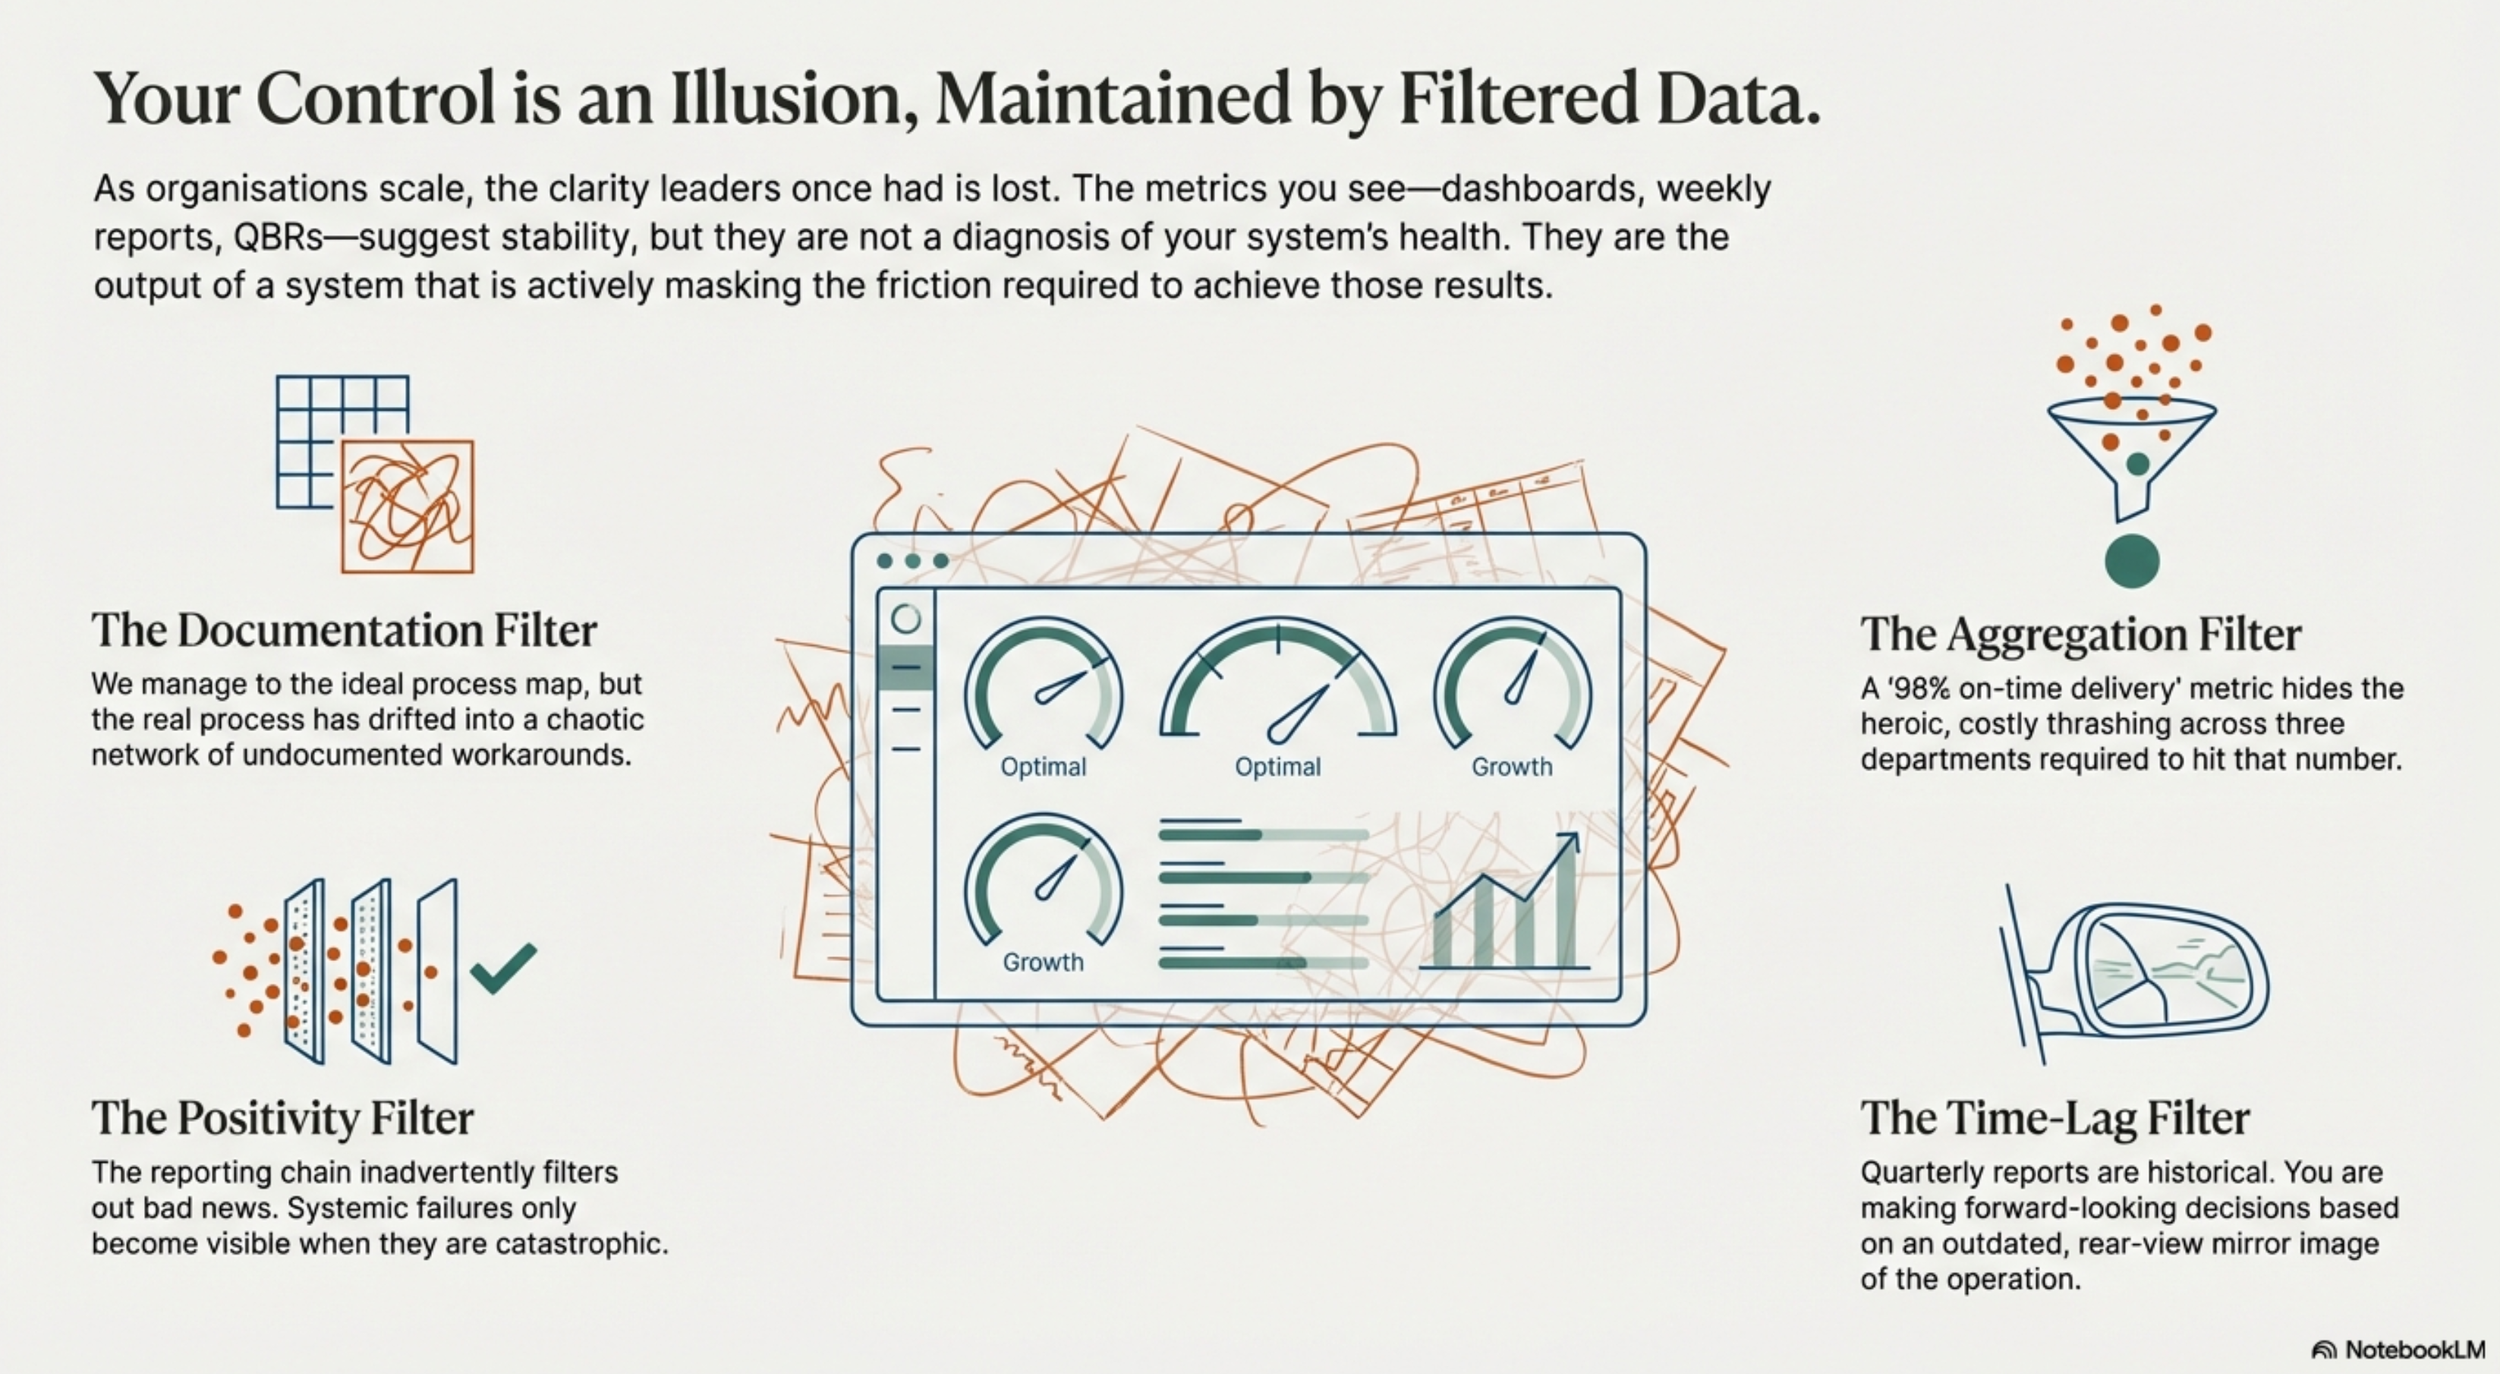
The Four Filters That Cloud Visibility:
The Documentation Filter (The Process Map Trap): Process maps and SOPs are often created by idealists, not front-line workers. They capture the intent of the system—how work should flow. But as the organization grows, adapts, and responds to countless edge cases, the actual, lived process drifts significantly from the documented one. The COO receives an assurance of order (the map) while the reality is a chaotic network of undocumented workarounds.
The Aggregation Filter (The Dashboard Delusion): Operational data is aggregated up through the reporting chain. A "98% on-time delivery" metric sounds excellent. What the dashboard hides is the heroic, costly, and resource-intensive thrashing required across three different departments—each with its own manual spreadsheet and siloed tool—to hit that number. The COO sees the aggregated result, not the friction involved in achieving it.
The Positivity Filter (The "Good News Only" Bias): No subordinate wants to deliver bad news to an executive. The reporting chain inadvertently becomes a "good news" filter, where small issues are solved locally, friction is absorbed and minimized, and the message that reaches the top is one of competence and control. The COO only learns about systemic failures when they are catastrophic, not when they are bubbling up as manageable friction.
The Time-Lag Filter (The Rear-View Mirror): The data COOs rely on—quarterly variance reports, monthly P&Ls—are historical. They describe what did happen. The organization is always moving faster than its reporting mechanisms. This lag means leaders are perpetually making forward-looking, high-stakes decisions (e.g., where to invest in automation, which team to restructure) based on incomplete or outdated signals.
The result? The COO is running a complex, high-performance engine while only looking at the gauge for Oil Pressure (output). They have no visibility into the Vibration Sensors (friction), the Clogged Air Filters (bottlenecks), or the Engine Temperature (burnout) that are actively threatening the whole system. They believe they have control because the outcome is currently satisfactory, but the operational mechanics are invisible and deteriorating.
2. The Hidden Cost of Friction
Friction is the organizational tax paid for complexity, bad design, and poor decision hygiene. It is not an abstract concept; it is a measurable drag on time, capital, and human energy. For a COO, friction is operational debt that quietly accrues until it manifests as catastrophic failure or systemic underperformance.
The illusion of control is maintained because employees are constantly paying this hidden tax to get the job done. The cost of this friction is realized in four tangible, destructive ways:
A. Decision Latency: The Unspoken Killer of Speed
Decision latency is the time it takes for a critical decision to move from inception (recognition of need) to resolution (actionable outcome).
The Problem: In scaled organizations, decisions are rarely made in a single meeting. They get stuck in "review cycles," waiting for consensus across siloed departments (Legal, Finance, Product, Operations). An employee needs approval for a non-standard order that takes 48 hours in the SOP, but in reality, it requires six emails, three meetings, and two different VPs to weigh in, stretching the time to five days.
The Cost: Every extra day is a day lost to a competitor, a day a customer waits, or a day that capital is locked up. Decision latency directly undermines agility and speed to market. It is the silent killer of strategic initiatives.
B. Meeting Overload: The Default Mechanism for Information Sharing
When processes are unclear and information is siloed, meetings become the default, low-resolution mechanism for sharing context and forcing resolution.
The Problem: Employees are pulled into meetings not to make a decision, but to "be informed," "get up to speed," or to "agree on the next steps" because the process for handoffs is broken. Meeting transcripts reveal the same questions being asked repeatedly, signals that the system is failing to capture and share context effectively. The organization substitutes clear workflow documentation with collective, costly communication.
The Cost: This is a direct drain on high-value time. The COO's budget for "deep work" is constantly being eroded by mandatory, low-value information-sharing ceremonies.
C. Execution Drag: The Rework and Waste Tax
This is the cost of doing the same work multiple times due to poor handoffs or inconsistent execution.
The Problem: Due to a lack of shared operational signals, a customer service agent may log a ticket in one system, requiring a back-office team to manually copy and re-enter data into a legacy system, and then requiring Finance to reconcile the data through a third tool. This duplication, rework, and effort spent correcting errors (the "fixing" work) can consume 20-40% of an organization's collective bandwidth.
The Cost: Wasted salaries and misdirected effort. When employees are constantly doing "fixing" work instead of "value-creating" work, the operational leverage of the organization declines exponentially.
D. Burnout: The Human Cost
Ultimately, friction is absorbed by people. When systems break, employees step in to be the "glue," the manual integrator, the patient chaser of approvals, and the solver of repetitive problems.
The Problem: The top-down pressure to hit targets remains, but the bottom-up complexity grows. Employees are celebrated as "heroes" for finding workarounds, when in fact, the system forced them into heroism. They are not monitored for productivity, but they are ground down by inefficiency.
The Cost: Talent drain, low morale, and reduced cognitive capacity. Burnout is the most severe and most delayed signal of operational failure. The COO's best people are leaving not because of compensation, but because they are exhausted by fighting the organization's self-inflicted complexity.

3. Why Transformation Misses the Mark
COOs are highly aware of the need for transformation. Billions are spent annually on initiatives designed to fix these problems. Yet, many of these efforts—from massive ERP implementations to focused business process reengineering (BPR)—fail to deliver the promised returns or, worse, introduce new complexity.
The failure is rooted in a fundamental flaw in the diagnostic process: Existing approaches provide incomplete, idealized, or lagging signals, leading to misaligned investment.
A. Surveys: Self-Reported, Infrequent, Biased
The Failure: Surveys (like employee engagement polls) capture sentiment or perceptions of friction, not the mechanics of friction. Employees might report "too many meetings," but the survey cannot tell the COO why those meetings are necessary, which process breakdown causes them, or which department is the decision bottleneck.
The Limitation: They are self-reported (biased by optimism or fear) and infrequent (typically annual), making them a poor basis for continuous, surgical transformation.
B. Process Maps & BPR: Describing Intent, Not Reality
The Failure: Traditional Process Mapping and BPR rely on workshops and interviews to define the "As-Is" state. The result is a reflection of the team's shared belief about the process, which is inevitably idealized and lacks the messy, actual complexity of the process logs. They describe the high-level steps, but miss the 15-step approval loop or the manual data export required for 20% of cases.
The Limitation: They describe the intended state (or a sanitized version of the current one) and are a static, point-in-time snapshot. They cannot track process drift or execution variance over time.
C. Consultants: Point-in-Time, Expensive, and Tool-Specific
The Failure: Consultants arrive, spend 6–12 months interviewing stakeholders, and deliver a set of findings, usually confirming a suspicion the COO already had. Their insights are dependent on the limited scope of their engagement and the data they are granted access to (often siloed tool analytics).
The Limitation: Once the engagement ends, the insight stops. They are expensive, and their recommendations are not backed by a continuous feedback loop. They solve the problem for a moment, not for the future.
D. Tool Analytics: Siloed, Lacking Context
The Failure: Every department has a SaaS tool (CRM, ERP, ticketing system). Each tool generates detailed analytics about activity within its walls. The Head of Sales sees CRM activity; the Head of Finance sees ERP transactions. But the COO needs to understand the end-to-end workflow—for example, how a sales opportunity converts into a recognized cash payment. The handoff between tools (and teams) is the most critical area of friction, and it is here that tool analytics go blind.
The Limitation: They provide a great view of the "silo," but no view of the "handover." They lack the cross-functional context necessary for enterprise-level operational intelligence.
What's Missing? A continuous, objective, system-level mirror that reflects the real-time execution reality of the organization across all functions and tools.
4. Complexity Is an Operating Decision
The most critical realization for the COO is that the massive, hidden friction outlined above is not a natural disaster; it is, in large part, an outcome of leadership and operating choices. Complexity is the silent debt created by well-intentioned decisions that, in isolation, seemed smart, but when scaled, create systemic friction.
The COO must shift the framing from viewing complexity as an inevitable byproduct of growth to viewing it as operational debt created by past choices.
How Leadership Choices Quietly Create Friction at Scale:
Tool Sprawl (The "Best of Breed" Trap): The decision to allow every department to choose the "best-of-breed" tool for its specific need (e.g., one tool for project management, another for developer ticketing, a third for finance management) means the organization gains functional depth but loses operational breadth. The resulting integration tax and manual data reconciliation fall on the employee, introducing massive friction at the handoffs.
Organizational Design (The Silo Effect): Decisions to optimize for function (e.g., Finance, HR, Marketing) rather than optimizing for the end-to-end customer journey create silos. This design forces cross-functional work—which is almost all value-creating work—to rely on cumbersome, manual collaboration (i.e., meetings and emails) rather than integrated, seamless processes. The decision to create the silo is the decision to create the friction.
The "Add-a-Gate" Response (The Security and Compliance Tax): Every time there is a compliance failure, a security breach, or a service error, the immediate and sensible leadership reaction is to "add a gate" or "require another approval." Each gate is a friction point, and while necessary, the cumulative effect of hundreds of these small, prudent decisions is a process that is so heavily encumbered that it grinds to a near-halt.
Misaligned Automation Investment (Automating the Mess): Without true visibility into the worst friction points, automation funds are often allocated based on visibility, passion, or the easiest-to-implement technology. The organization invests in automating a perfectly fine process while the massive, people-intensive rework loop that is causing 80% of the drag remains untouched. They automate the symptom, not the cause.
Why This Works:
By framing complexity as operational debt—a consequence of accumulated, unaddressed operating decisions—the COO can depersonalize the problem.
Signals: This is your system, not your people. The focus shifts entirely from "Why are my people slow?" to "Which of my systems, tools, and design choices is actively making my people slow?"
It creates evidence-based transformation. The COO is no longer guessing where the highest ROI is; they have empirical evidence that "Process X in Region Y takes five times longer due to the approval loop between Finance and Legal" and can direct resources to the actual point of failure.
This realization—that operational intelligence is the key to managing the complexity created by scale—is the necessary prerequisite for adopting the Enterprise Listening capability.
ENTERPRISE LISTENING: OPERATIONAL VISIBILITY AT SCALE
5. From Customer Listening to Enterprise Listening
Modern organizations have mastered the art of listening to the outside world. Customer Listening, often called Voice of Customer (VoC), is a mature, mandated capability. We invest heavily in systems—CRM, surveys, NPS tracking, social listening, and sentiment analysis—to understand customer pain points, buying behavior, and loyalty drivers. This outward focus is essential; it guides product development, marketing spend, and service strategy.
However, a paradoxical operational blind spot exists: Organizations listen outward with great sophistication, but they remain functionally deaf to their own internal operational signals.
This imbalance creates a profound disconnection:
CapabilityFocusGoalLimitationCustomer ListeningExternalUnderstand what the customer wants and thinks.Cannot fix the internal process failure that causes customer pain.Enterprise ListeningInternalUnderstand how work flows and breaks to deliver the customer outcome.Cannot determine customer preference; it only fixes execution.
The COO is faced with the reality that customer complaints are often a symptom of an internal systemic failure, not a lack of customer empathy. For example, a customer reports a 10-day delay in issue resolution. The Customer Listening tool flags "Long Wait Times" and "Poor Communication." This information tells the COO what the customer is unhappy about, but it provides zero insight into why the delay happened:
Was the delay caused by a broken handoff between the Tier 1 and Tier 2 support teams?
Was it stuck for three days waiting for legal approval due to an unclear delegation matrix?
Did the data have to be manually entered into three different systems, leading to a transcription error that required rework?
The organization has the feedback, but it lacks the internal diagnostic tool to pinpoint the root cause of the operational friction. The customer is the mirror reflecting the symptom, but Enterprise Listening provides the X-ray of the organizational skeletal system to locate the fracture.

The Strategic Shift: Listening for Leverage
The shift from Customer Listening to Enterprise Listening is a strategic acknowledgment that internal friction is the biggest accelerator of external failure.
From Output to Mechanism: VoC measures output (customer satisfaction).2 EL measures the mechanism (process efficiency).
From Symptom to Root Cause: VoC identifies the symptom (delay). EL identifies the root cause (bottleneck).
From Reactive to Proactive: VoC is inherently reactive (listening to existing complaints). EL is proactive (identifying process weaknesses before they generate customer pain).
By implementing Enterprise Listening, the organization finally applies the same rigor and data-driven discipline it uses to understand its market to understand its own machine. It moves beyond knowing what is wrong to knowing where and why the system is failing its employees and, consequently, its customers.
6. The Organization Is Already Talking
The organization is not a silent, black box. Every action taken by an employee on a digital platform leaves a structured, measurable operational signal. The challenge is not gathering new data, but rather connecting and interpreting the existing data streams that already define how work flows.
The organization "talks" through four primary, massive streams of operational signals:
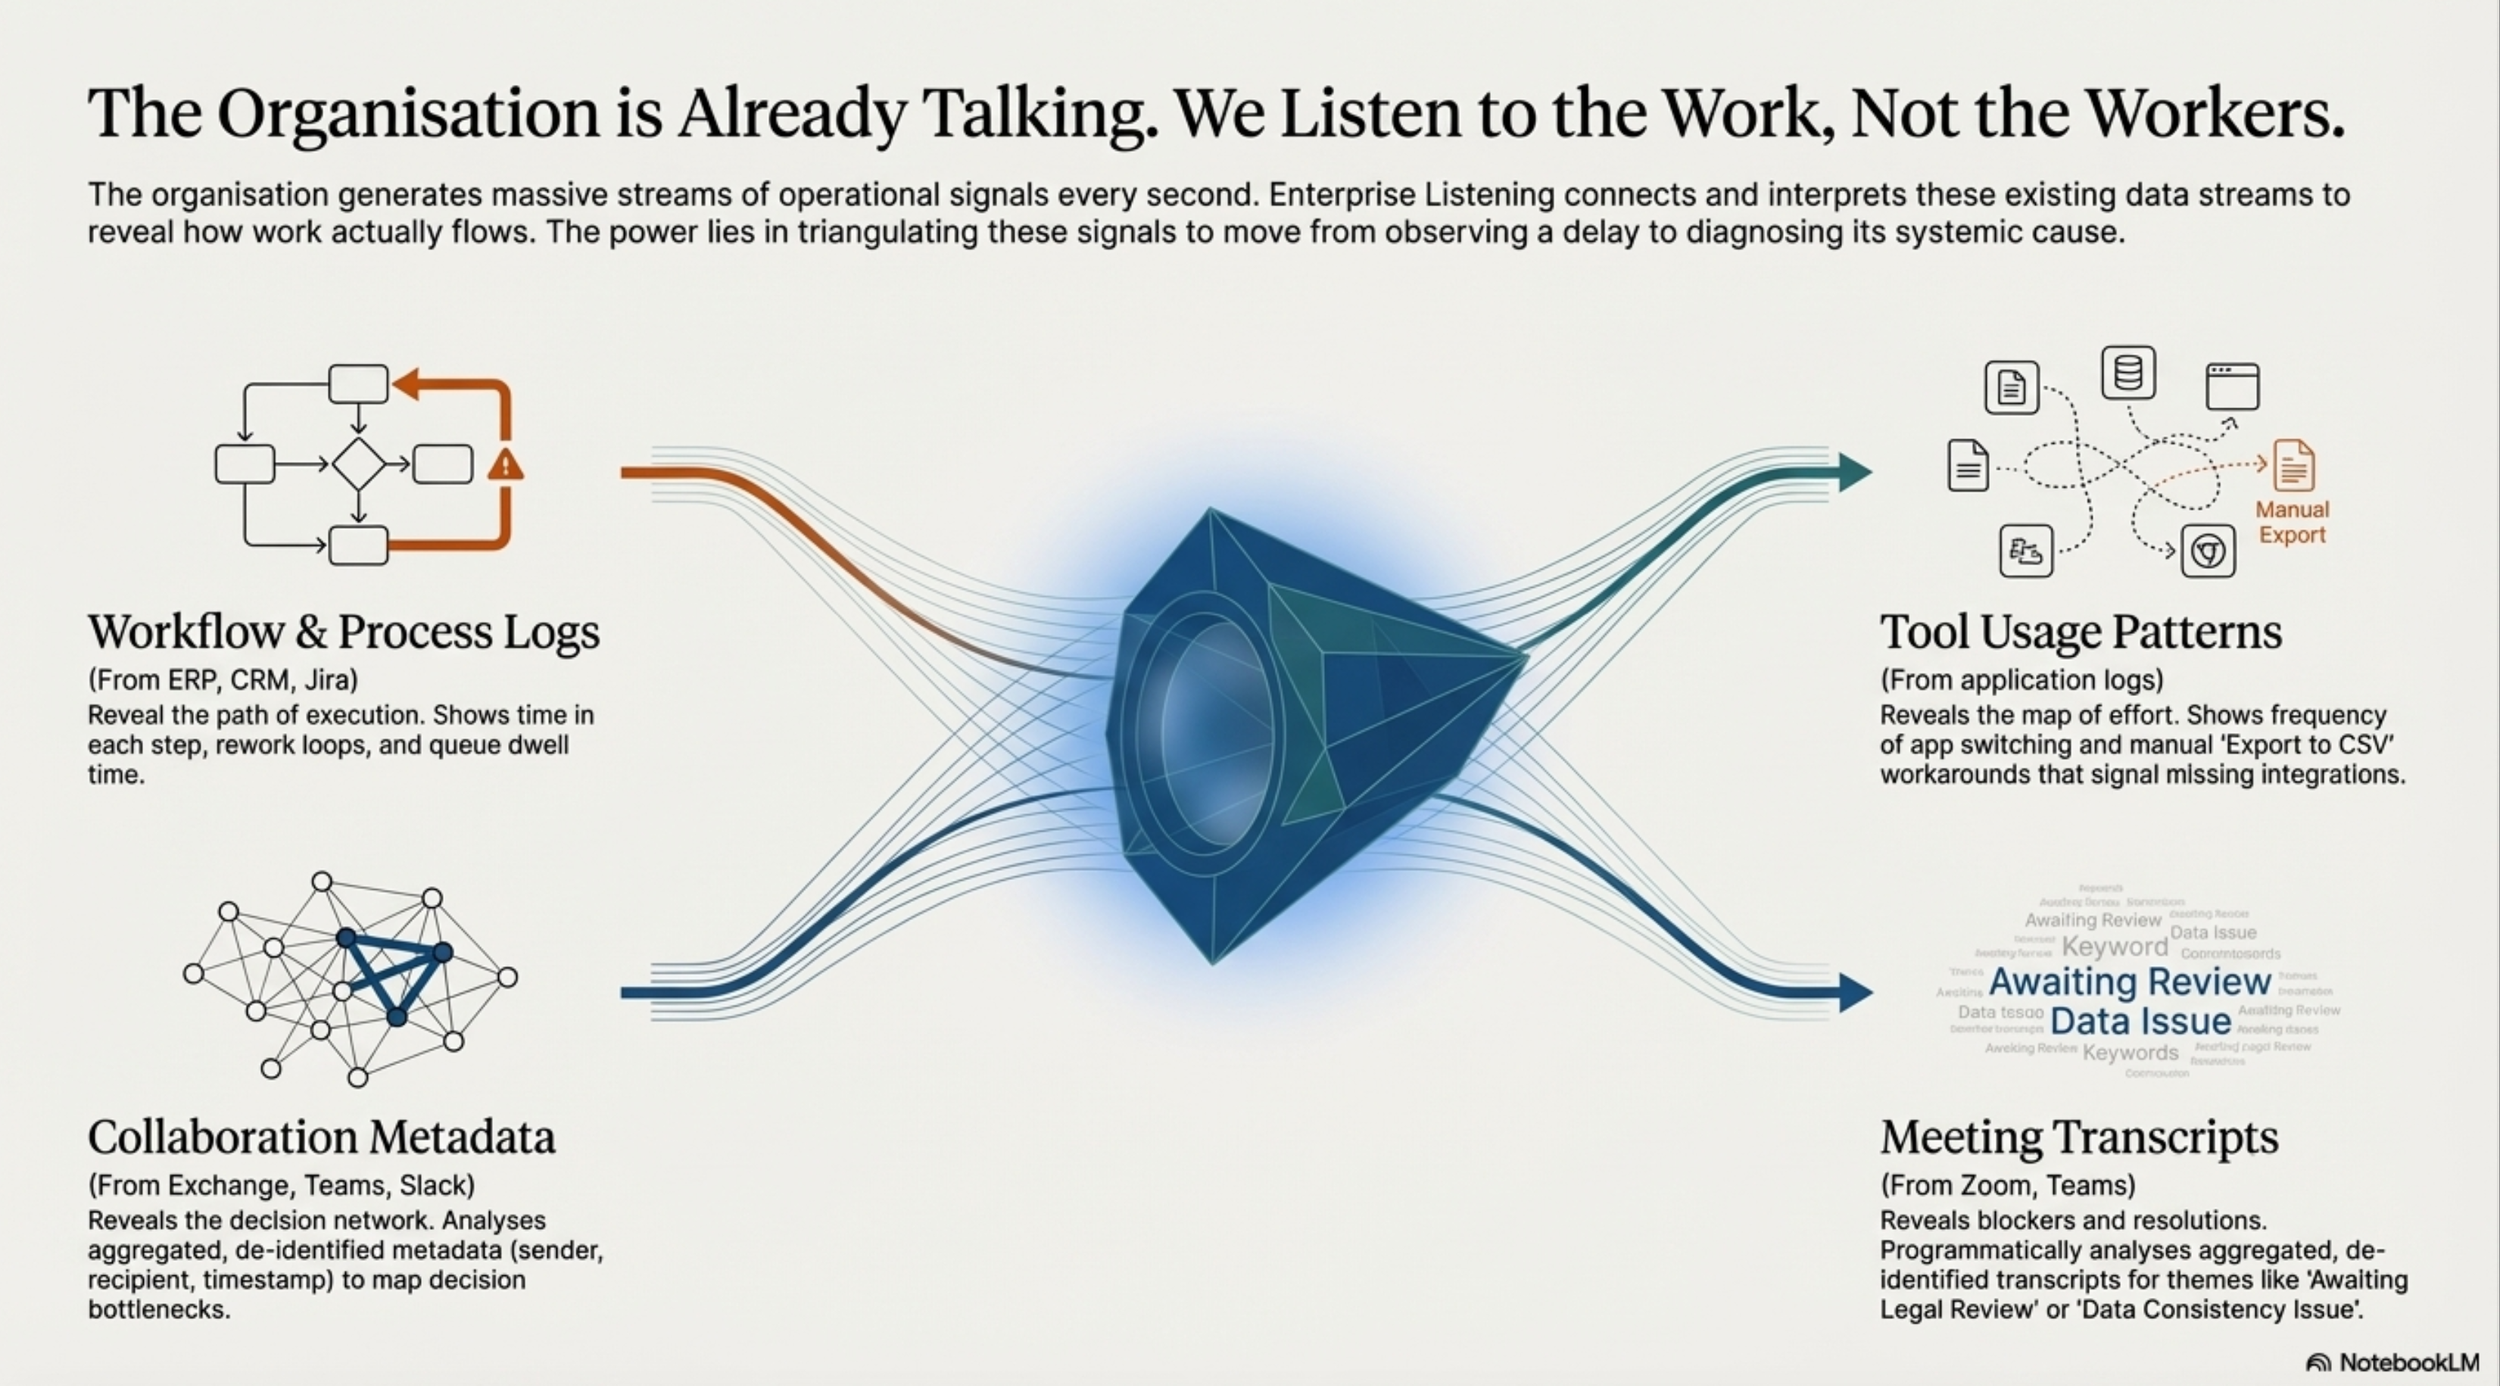
A. Workflow and Process Logs (The Path of Execution)
These are the most direct signal of how work moves through defined systems. Every system of record generates logs that capture state changes, timestamps, and user IDs.
Signals: Time taken in each step, rework loops, dropped handoffs, queue dwell time, and variance in execution path (e.g., in 70% of cases, the approval follows Path A; in 30%, it follows the slower Path B).
Source: ERP systems (SAP, Oracle), CRM systems (Salesforce), Ticketing Systems (Jira, ServiceNow), and custom application logs.
Insight Value: Directly reveals process drift from the documented map and pinpoints the single-step bottlenecks that consume the most time (where the flow stops).
B. Tool Usage Patterns (The Map of Effort)
These signals reveal which tools employees are actually using to complete a single end-to-end task, providing a map of the organization's collective effort.
Signals: Frequency of switching between applications, use of "export to CSV" followed by "upload from file" (manual data entry), adoption rates of new tools, and simultaneous usage of two tools designed to perform the same function (duplication).
Source: Metadata from application usage monitoring, endpoint logs, and shared drive activity.
Insight Value: Identifies tool sprawl friction and undocumented workarounds ("Shadow IT")—the manual steps people take because the integrated system is too cumbersome.
C. Email and Collaboration Metadata (The Decision Network)
Email, chat, and other collaboration tools are the nervous system of the organization, particularly for decisions requiring cross-functional input.3 Enterprise Listening only analyzes the metadata, not the content.
Signals: Volume of email exchanges required for a task (collaboration loops), time between the last email and the first subsequent meeting (decision latency), and the number of distinct teams involved in a single thread (cross-functional dependency).
Source: Aggregated, de-identified metadata from Exchange, Slack, Teams, etc. (Sender, Recipient, Timestamp, Subject Line).
Insight Value: Maps decision bottlenecks and reveals where complexity is managed through costly, repetitive communication loops instead of seamless system handoffs.4
D. Meeting Transcripts (The Blockers and Resolutions)
Meeting transcripts, when analyzed programmatically and in an aggregated, de-identified manner, provide a rich context layer often missing from pure process logs.
Signals: Frequency of specific "blocker" themes (e.g., "Awaiting Legal Review," "Data Consistency Issue"), identification of action items without clear owners, and the number of meetings required to close a specific project phase.
Source: Transcripts from conferencing tools (Zoom, Teams).
Insight Value: Offers insight into the nature of organizational friction—distinguishing between technical blocks, resource blocks, and human-created complexity. The system listens for the language of delay and friction.
The Power of Combination: The true power of Enterprise Listening lies in connecting these signals. A process log might show a 5-day pause (bottleneck). Linking this to collaboration metadata might reveal that the 5-day pause was a decision loop that required 14 emails across three teams, and a review of the meeting transcripts might reveal that the delay was due to a recurring data quality issue. This triangulation allows the COO to target the system fix, not just observe the time delay.
7. Listening to Work, Not Workers
The success of Enterprise Listening hinges entirely on maintaining an inviolable, ethical boundary: It must listen only to the structure and flow of work, and never to the performance or intent of individual employees.
This is not just a technical constraint; it is a non-negotiable governance pillar that protects employee trust, legal compliance, and the organizational culture. Without this commitment, Enterprise Listening immediately transforms into employee surveillance, leading to suspicion, resistance, and the distortion of the very data it seeks to analyze (employees will change behavior to game the system).
The Ethical Boundaries: The Three-Layer Red Line Defense
The operational design must incorporate three layers of non-negotiable protections:
1. Data Aggregation and De-Identification (The Technical Wall):
Individual Data Masking: All operational signals (logs, metadata, transcripts) must be immediately de-identified or pseudonymized at the point of ingestion. Insights are generated and presented only at the team, department, region, or process level.
No Individual Performance Metrics: The system will not generate reports on "Employee X's email volume," "Employee Y's time spent in tool," or "Employee Z's sentiment score." Metrics focus strictly on system-level outcomes (e.g., cycle time, decision latency, handoff quality).
Content vs. Metadata: The system must process only collaboration metadata (who, when, subject) or thematic tags derived from transcripts (e.g., "Budget Blocker," "Legal Review Needed"). It is strictly forbidden from analyzing the raw, private content of communications.
2. Governance and Oversight (The Veto Power):
The Governance Council (Mandatory Veto Holders): As outlined in the proposal, the Enterprise Listening Governance Council—including Legal & Compliance, HR / People Ops, and Employee Representatives—must have veto power over all charter changes, scope expansions, and new use cases.
Banned Use Cases: The list of explicit red lines (No individual performance monitoring, No HR discipline use, No covert monitoring) must be formalized into the operational charter and non-negotiably enforced by the Council.
3. Intent and Framing (The Cultural Contract):
Focus on System Fixes: The results of Enterprise Listening are fed exclusively into operational functions: Transformation, Automation, and Process Improvement. They are explicitly blocked from use in Personnel Management.
The Mirror, Not the Microscope: The communication strategy must consistently frame the capability as a mirror reflecting organizational complexity, not a microscope scrutinizing individual behavior. The goal is to improve the employee experience by fixing bad systems, eliminating repetitive, soul-crushing work, and empowering people to focus on high-value tasks.
By adhering to the mantra, "Fix the system, don't police the people," the COO can secure employee trust, which is the ultimate prerequisite for successful, long-term operational intelligence adoption.

8. The Mechanics Behind the Insight
The sophisticated insights delivered by Enterprise Listening are the result of combining advanced analytical techniques—rooted in data science and network theory—with the robust data governance framework outlined above. This capability requires technical credibility while remaining explicitly non-invasive.
The core mechanics rely on two primary technologies: Process Mining and Organizational Network Analysis (ONA).
A. Process Mining: Reconstructing the Operational Truth
Process Mining is the engine that reconstructs the actual execution reality from the workflow and tool logs.5 It allows the COO to see what actually happens, not what the map suggests.
Event Logs: The process begins by collecting raw, de-identified event logs. Each log entry must contain three core data points:
Case ID: A unique identifier for the specific instance of the work (e.g., Order #4533, Ticket #908).
Activity: The step that was executed (e.g., "Awaiting Approval," "Data Entry Complete," "Handoff to Finance").
Timestamp: The exact time the activity occurred.
Discovery: The Process Mining algorithm uses these logs to automatically discover, visualize, and model the true process map.6 It doesn't rely on interviews or workshops; it builds the map empirically from the data.
Conformance Checking: The algorithm then compares the discovered actual process map against the ideal documented map. This immediately highlights process drift and quantifies the frequency and cost of deviations, rework loops, and manual intervention steps.
Technical Value: Process mining pinpoints the exact 5% of process steps that consume 80% of the cycle time, providing surgical, data-driven prioritization for automation or simplification.
B. Organizational Network Analysis (ONA): Mapping the Invisible Ties
ONA is the technique used to interpret the collaboration metadata (email/chat/meeting flows). Unlike traditional HR-driven ONA which maps communication between people, Enterprise Listening uses ONA to map communication patterns between process steps and teams.
Nodes and Edges: In this context, the "nodes" are the teams, departments, or specific process steps (e.g., "The Legal Review Process," "The Billing Team"). The "edges" are the collaboration metadata (the volume of email, the duration of meetings) that link them.
Density and Centrality: The ONA algorithm identifies:
Centrality: Which teams or steps are disproportionately central to the flow of information (i.e., decision bottlenecks or critical knowledge brokers).
Density: The level of communication required to complete a handoff. A high-density edge between two teams means their communication is costly and friction-intensive.
Decision Friction Score: By layering decision latency (time between communications) onto the network, the system can quantify the Decision Friction Score for any end-to-end workflow.
Technical Value: ONA moves beyond simple time measurement to expose the hidden organizational cost required to overcome structural friction, quantifying the tax paid in meetings and email loops.
C. The Blending and Automation Prioritization
The final step is the blending of Process Mining data (where the process breaks) with ONA data (why the process breaks in terms of communication/delay). This leads directly to the core output: Evidence-Based Automation and Simplification Opportunities.
The system can rank opportunities based on impact (cycle time reduction from Process Mining) and feasibility (complexity of the social/communication fix from ONA).
This technical foundation provides the credibility and objectivity needed for the COO to sell the solution internally. By using rigorous, system-focused methodologies and maintaining the highest ethical bar through de-identification, Enterprise Listening delivers operational insight without crossing the critical line into surveillance.
WHAT COOs ACTUALLY SEE WHEN THEY LISTEN
Enterprise Listening transforms the COO's view from a high-level, output-focused dashboard to a granular, diagnostic X-ray of the operational machinery. It moves the discussion from subjective performance to objective system health. When the COO begins to "listen," they are not seeing individual underperformance; they are seeing data points that consistently trace back to four core design failures within the organization.
9. Where Execution Slows Down
The most common operational myth is that work slows down due to a lack of effort. Enterprise Listening disproves this by showing that execution drag is overwhelmingly caused by structural impediments. The system highlights three critical failure points where value-creating activity stops or reverses.

A. Bottlenecks: The Dwell Time Killer
A bottleneck is any single step in a workflow that consistently takes significantly longer than all other steps, causing a queue to build up behind it.
The Illusion: The COO often believes the entire team responsible for a process step is slow.
The Reality from Enterprise Listening: Process Mining reveals that 80% of the queue time is spent in a single, specific step, often owned by a resource outside of the primary operational team.
Example 1: The Single Approver: The "Contract Finalization" process takes 15 days. Analysis reveals the task sits for 12 days in the queue for a single, designated Legal Compliance Officer (LCO) who is the only authorized person for a specific jurisdiction. The bottleneck is the LCO's single-point-of-failure status and lack of delegation, not the legal team’s capacity as a whole.
Example 2: Legacy Data Entry: An "Order-to-Cash" process stalls after the order is received. The log shows a 48-hour pause labeled "System Synchronization." This pause is the time a data entry clerk needs to manually log into an antiquated system to re-enter data that the CRM should have passed automatically. The bottleneck is the lack of system integration.
Enterprise Listening allows the COO to visualize the true process flow and measure Dwell Time (the time a work item spends waiting) versus Processing Time (the time a human spends actively working on it). The data consistently shows that the majority of cycle time is wasted in Dwell Time.
B. Rework Loops: The Cost of Fixing the Fix
Rework is the most expensive type of work because it involves undoing and redoing effort that was already considered complete.
The Illusion: Rework is perceived as an error in execution by the employee who completed the first step.
The Reality from Enterprise Listening: Process logs show that rework loops are almost always triggered by a failure in handoff quality or data consistency.
The Hand-off Failure: A request moves from Team A (Triage) to Team B (Execution). Team B sends the task back to Team A because a required field (e.g., Customer ID) was missing. The Enterprise Listener highlights the frequent loop between these two teams. The friction is not a careless employee; it's a poorly designed handoff gate or inadequate data validation in Team A's system.
The Consistency Failure: The process flow for "New Customer Onboarding" is found to have two distinct paths: Path X (for EMEA) and Path Y (for APAC). Path Y has a 30% higher rework rate. This reveals an inconsistent process design across regions—a systemic failure that penalizes one operating unit with excessive rework.
By quantifying the frequency and cost of these loops, the COO can target resources to build robust handoff mechanisms, implement automated data validation, or standardize processes globally.
C. Invisible Handoffs: The Unmanaged Void
Invisible handoffs occur when a work item transitions between two distinct systems or teams without a formal, monitored trigger or queue. This is often where work vanishes or languishes.
The Illusion: The COO believes the process is automated or synchronous between systems.
The Reality from Enterprise Listening: The process log stops at "Sent to Finance System." The Finance System log doesn't show the work item for 72 hours. Collaboration metadata reveals a flurry of emails from the originating team to Finance asking, "Did you get my request?" The work item is stuck in an unmanaged email inbox queue or requires a person to manually export a file and upload it elsewhere.
The Problem: The operational metric for the first team registers the task as "Complete," while the downstream team has not yet begun. This creates a hidden delay that cannot be seen on siloed dashboards. Enterprise Listening connects the dots between the siloed systems to expose the black hole of the manual handoff.
10. Decision Latency Is a Design Problem
One of the most corrosive forms of friction is slow decision-making. Enterprise Listening reveals that "slow decisions" are rarely the result of indecisive people, but rather the logical outcome of a flawed organizational and technical structure. Decision latency is a design problem.
A. The Social Cost of Consensus
When systems lack clear data and processes, decisions are forced to rely on social consensus, leading to extended, costly decision loops.
The Data Signal: Collaboration Network Analysis (ONA) highlights that a critical decision (e.g., approving a non-standard marketing spend) is linked to a highly dense cluster of communication involving 5-7 different functional groups (Legal, Finance, Marketing, Operations, IT).
The Friction: Each additional person or team in the approval loop increases the cognitive and scheduling overhead exponentially. The meeting transcripts and email metadata will show the decision bouncing back and forth as different departments ask for slightly different data or apply slightly different interpretations of policy. The time spent is not deliberation; it is organizational coordination tax.
The Fix: The COO's insight is to reduce the number of nodes (teams/people) required to make the decision by pre-wiring the system with rules and data. If the data is consistently available and validated upfront, and the policies are clearly delegated, the social consensus loop can be replaced with a single, quick system approval.
B. The Unclear Decision Rights (The 'Hot Potato' Problem)
Enterprise Listening illuminates how responsibility is deferred when accountability is unclear.
The Data Signal: Meeting transcripts show an "Action Item: Decide on Price Model" being repeatedly carried over from one week to the next. The ONA shows no single owner for the decision (no "central node" of accountability) across the key teams involved.
The Friction: The decision becomes a "hot potato" that everyone agrees needs to be made, but no one is empowered or willing to be the sole signatory. This is the organizational default when decision rights are vague. The team spends time deciding who should decide, rather than deciding the issue itself.
The Fix: This insight is fed directly to HR and the Executive team to clarify the RACI matrix (Responsible, Accountable, Consulted, Informed) for critical operational decisions, replacing the expensive, low-resolution "consensus meeting" with a high-resolution, single-point accountability structure.
C. The Knowledge Broker Bottleneck
In many organizations, critical information or institutional memory is not stored in a shared system but is siloed within key individuals, creating a "Knowledge Broker Bottleneck."
The Data Signal: ONA highlights an individual who is highly central to dozens of cross-functional workflows, receiving and sending an unusually high volume of metadata related to "exceptions" or "approvals."
The Friction: This person is not intentionally slowing the process; they are simply the only person who knows the three legacy systems well enough to manually reconcile data, or the only person who remembers the specific corporate policy for a niche situation. They are the human API connecting disparate systems. The bottleneck is the inevitable capacity limit of that individual.
The Fix: The COO identifies this person not as a star performer to be rewarded, but as a systemic vulnerability whose knowledge must be extracted, digitized (into a decision engine or knowledge base), and scaled.
11. Shadow Work Is Signal, Not Misconduct
"Shadow Work" is defined as any activity employees perform outside of the sanctioned systems or processes to successfully complete their job. This often takes the form of manual spreadsheets, personal databases, private chat groups for issue resolution, and workarounds.
The Illusion: Shadow work is viewed by IT and Operations as misconduct, non-compliance, or a failure of employees to adopt the "official" tool.
The Reality from Enterprise Listening: Shadow work is the strongest objective signal of operational failure. It is employees finding the path of least resistance when the official path is too difficult, slow, or broken.
A. The Manual Data Bridge
The most common form of shadow work is the manual data bridge.
The Data Signal: Tool usage patterns show frequent "Export to CSV" activity from System A, followed by the opening of a desktop application (Excel/Google Sheets), followed by "Import from File" activity into System B. Collaboration metadata may show an email loop labeled "Data Transfer Check."
The Friction: The employee is spending hours performing the role of the missing integration middleware. They do this not because they are idle, but because the sanctioned, integrated process is unavailable or unreliable. This manual reconciliation introduces latency, human error, and compliance risk.
The Insight: The COO sees a prioritized list of these manual bridges, allowing IT to target the specific, high-friction integration points that will deliver the highest employee experience (EX) and operational ROI (replacing the spreadsheet with an API connection).
B. The "Back Channel" for Resolution
When the official service ticketing or request system is too slow, employees create "back channels" to resolve issues faster.
The Data Signal: Enterprise Listening shows that 80% of critical "Level 1 support" tickets are resolved quickly, but the remaining 20% often have low activity on the official ticketing system. However, ONA reveals high chat activity (Teams/Slack) between the requestor and the subject-matter expert, often marked with terms like "Urgent" or "Can you help me offline?"
The Friction: The official system is perceived as a graveyard for requests. The employees bypass the process to maintain speed and service levels, effectively operating a "Shadow Help Desk." This destroys auditability and prevents the organization from learning from its exceptions.
The Insight: The COO learns the sanctioned process is creating a service failure. The fix is not to ban chat, but to diagnose why the official ticketing workflow is perceived as too slow or unresponsive, likely due to a bottleneck identified in section 9.
12. The Meeting Explosion
Meetings are not intrinsically bad; they are an essential tool for complex human interaction. However, Enterprise Listening reveals that in high-friction organizations, meetings multiply because they are replacing broken processes and failing information systems.
The Illusion: Meeting overload is seen as a cultural problem or a sign of poor time management by employees.
The Reality from Enterprise Listening: Meetings are the organizational shock absorber for system-created complexity.
A. Meetings as a Substitute for Shared Data
The Data Signal: Meeting transcripts show an excessive amount of time spent on "context sharing," "data validation," and "aligning on the numbers." Phrases like, "Wait, what's the number from your system?" or "Can you walk us through that data set?" dominate the first half of the agenda.
The Friction: When data systems are siloed and reporting is inconsistent, teams cannot trust a single version of the truth. They are forced to meet to verbally synchronize data, which is the slowest, most expensive, and lowest-fidelity method of synchronization available.
The Insight: The COO sees that the investment needed is not meeting management training, but master data management and unified reporting dashboards that eliminate the need for verbal data reconciliation.
B. Meetings as a Substitute for Clear Handoffs
The Data Signal: Collaboration ONA shows a dense loop of email exchange followed by a mandatory meeting labeled "Handoff Review" or "Kick-off." The process log shows a "Send to Team X" step followed by a 48-hour pause before the next step is logged.
The Friction: The team responsible for the next step (Team X) cannot trust that the preceding team has provided all the necessary inputs. The meeting is the manual quality assurance gate used to confirm completeness and clarity before starting work, protecting the execution team from rework loops.
The Insight: The COO can show that removing the meeting requires improving the system of the preceding team—building automated validation checks into the process so that Team X receives a digitally guaranteed, complete package, making the manual review meeting redundant.
By viewing the meeting explosion as a symptom of process atrophy, the COO is empowered to reverse the trend not through mandates to reduce meeting time, but through surgical fixes to the underlying system failures that force people to meet in the first place.

FROM INSIGHT TO OPERATING ADVANTAGE
The previous sections established that Enterprise Listening provides a diagnostic view of operational friction and systemic complexity. Part IV is the critical bridge from diagnosis to cure. It defines how the Chief Operating Officer (COO) converts raw operational insights—bottlenecks, rework loops, and decision latency—into a prioritized, high-ROI execution backlog that secures a long-term operating advantage.
13. Turning Signals Into an Execution Backlog
The challenge after successfully identifying points of friction is prioritization. A scaled organization has hundreds of process flaws; the COO must determine which three, if fixed, will deliver 80% of the possible operational leverage. Enterprise Listening solves this with a data-driven prioritization matrix that moves beyond intuition and departmental politics.
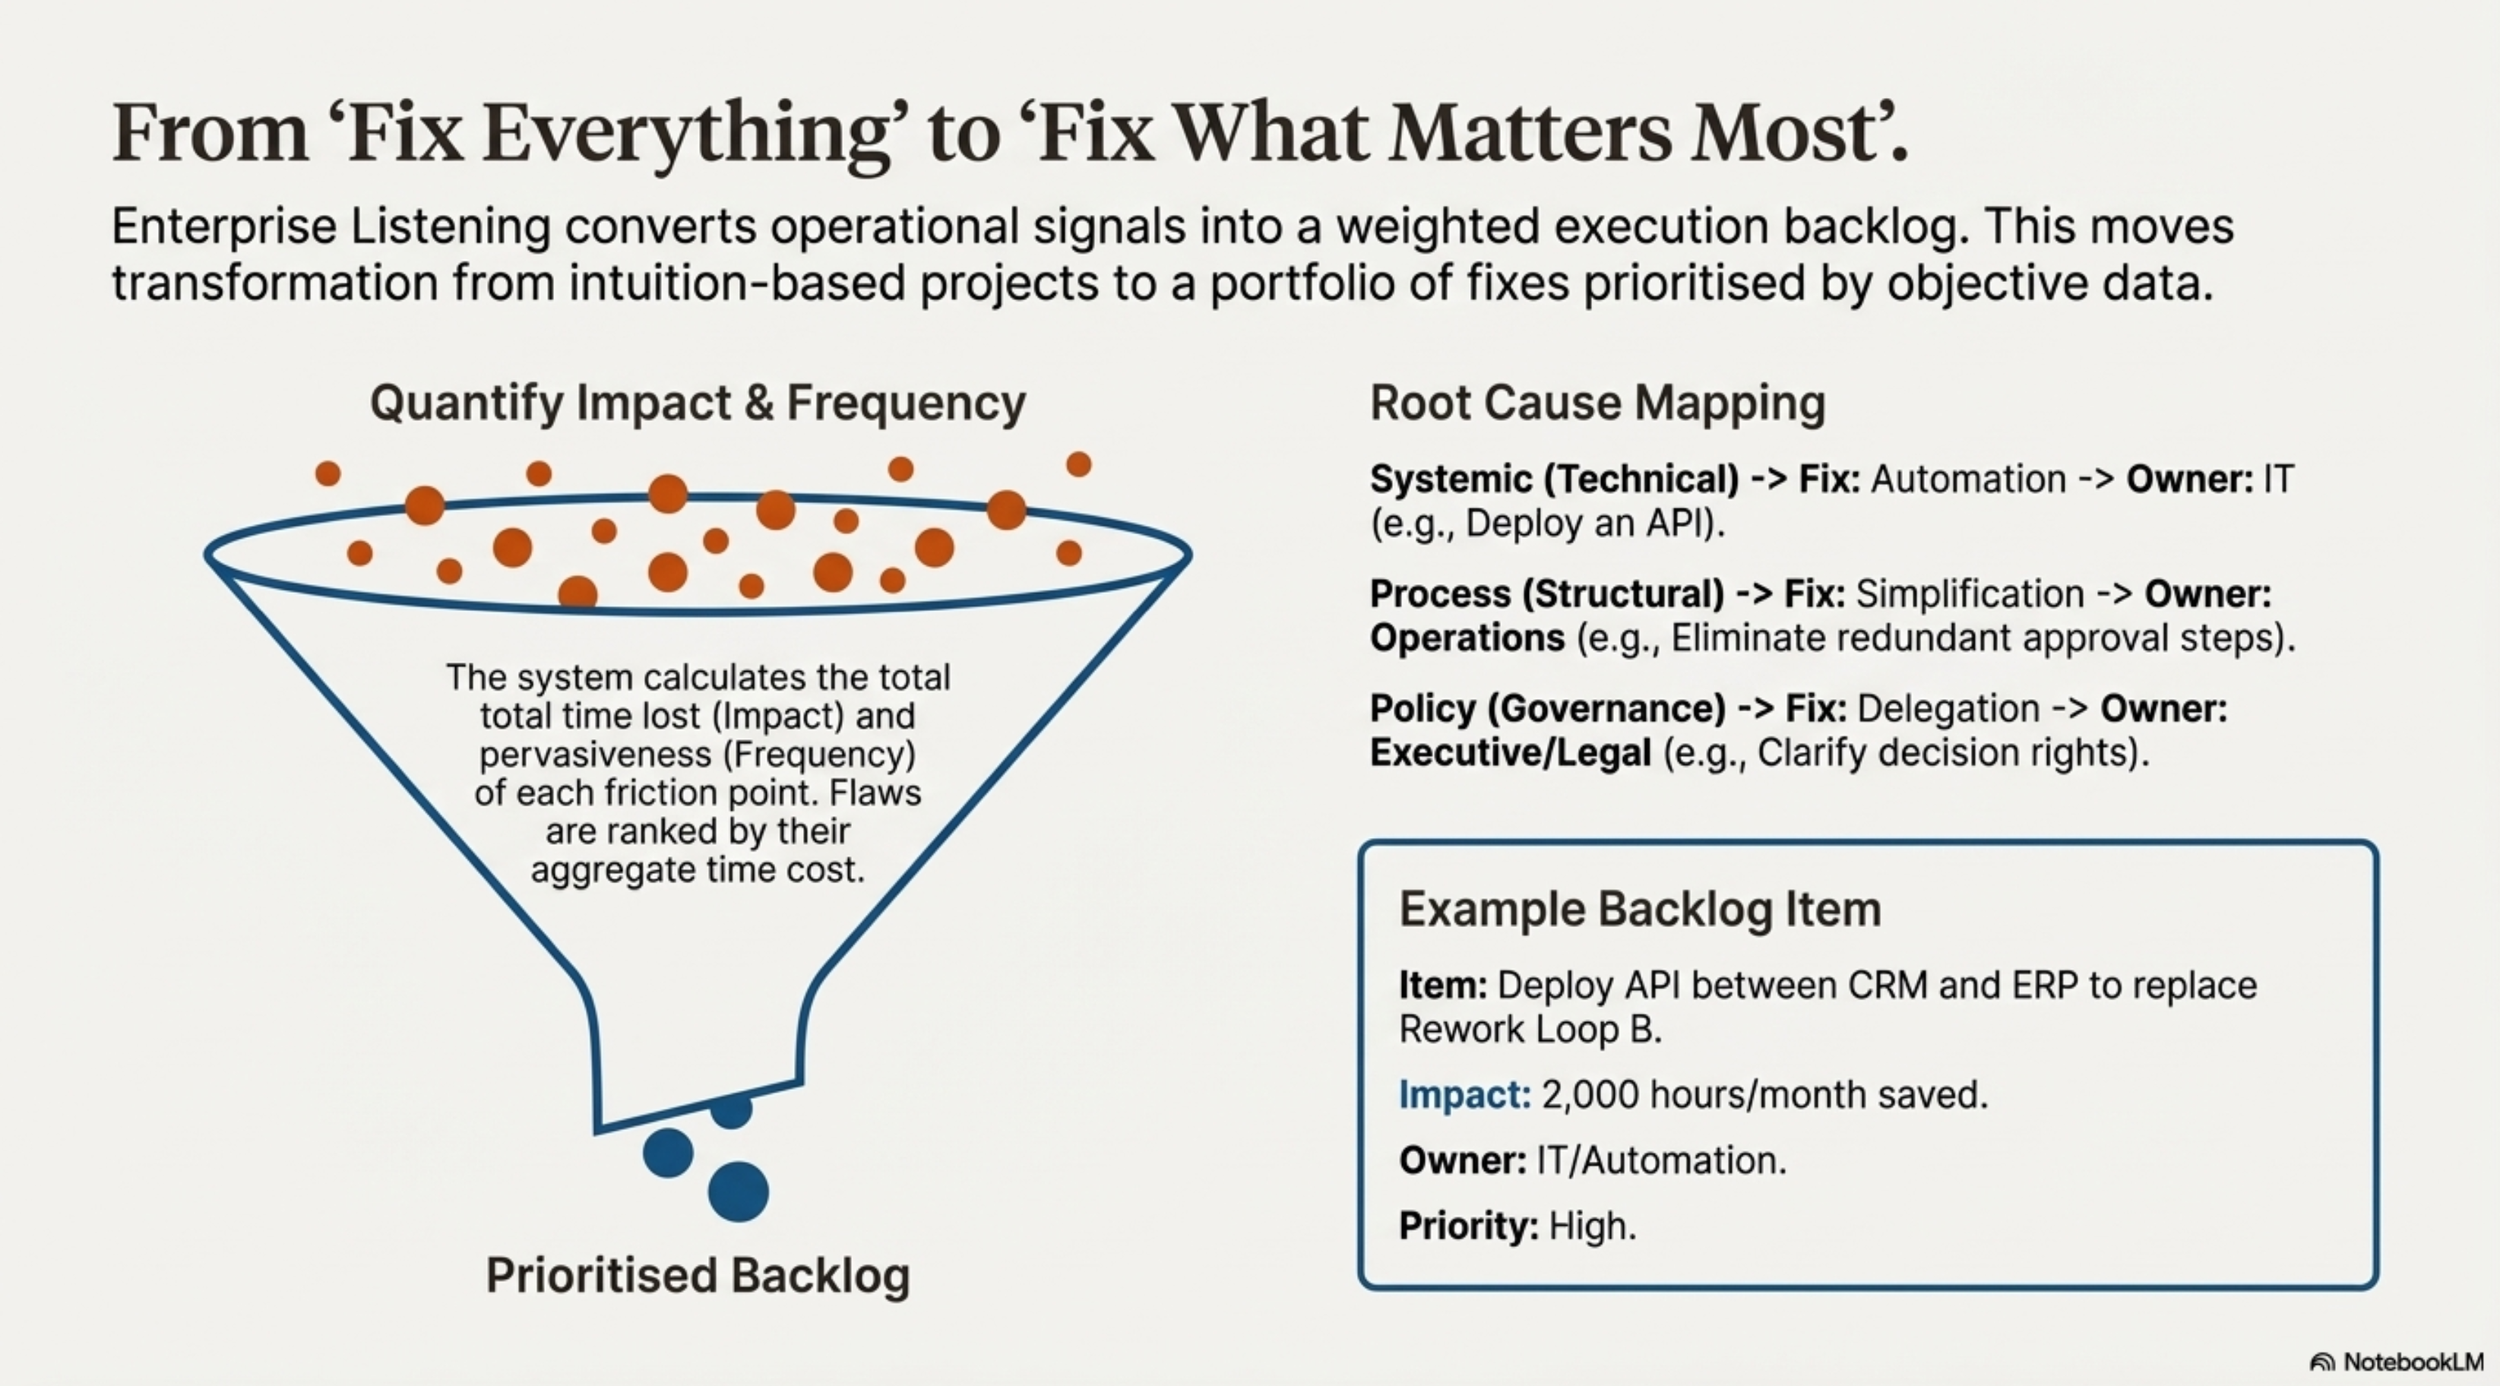
The operational signals are synthesized into a weighted backlog using three primary criteria: Impact, Frequency, and Root Cause.
A. Quantifying Impact and Frequency
The initial triage is an objective, quantitative assessment based on the Process Mining data:
Quantifying Impact (The Time Cost): The system calculates the total cumulative time lost to a specific process flaw across all instances over a period.
Example: Bottleneck A (Legal Approver) causes 5 days of delay on 50 critical contracts per month. Total Impact: 250 days of delay per month.
Example: Rework Loop B (Missing Data Validation) occurs 500 times per month, costing 4 hours of manual effort per loop. Total Impact: 2,000 hours of rework per month.
Prioritization: Flaws are ranked by their aggregate time cost, giving the COO an objective, monetary value (staff time or lost revenue opportunity) for the fix.
Quantifying Frequency (The Scale): The system measures how often the flaw occurs and how pervasive it is across teams or regions.
A flaw that occurs 10 times a month in a critical, high-volume workflow is prioritized over a flaw that occurs 5 times a month in a niche workflow. This ensures that resources target problems that truly exist "at scale."
B. Mapping Root Cause to Solution Type
Once ranked by impact, the next step is to categorize the flaw by its root cause, which dictates the type of fix required (and thus, the owner and cost):

This matrix is the COO’s command tool. Instead of saying, "Fix the delays in the Customer Onboarding process," the COO can generate a specific backlog item:
Backlog Item: Deploy API integration between CRM and ERP to replace Rework Loop B (Manual Data Validation). Impact: 2,000 hours/month of rework saved. Owner: IT/Automation Team. Priority: High (Target for Q1 deployment).
This level of precision ensures that transformation spend is hyper-focused on quantified process debt, not organizational ambition.

14. Designing Systems From Reality
A common and costly failure in large organizations is the launch of new software platforms or internal tools that fail to achieve adoption. This happens because the systems are designed based on an idealized process map or the vendor’s best practices, ignoring the messy, actual reality of how work gets done.
A. The “Build it, and They Will Leave” Failure
When a new system (e.g., a shared services portal or a new financial reporting tool) is introduced:
The Problem: If the new system does not account for the Shadow Work that employees have created to overcome the existing process flaws, employees will continue to use their shadow systems (manual spreadsheets, back-channel emails).
The Result: The new platform becomes another siloed tool, the operational debt remains, and the organization has spent millions of dollars to increase complexity by adding another application to the landscape.
B. Enterprise Listening: The Pre-Mortem for Platform Design
Enterprise Listening acts as the mandatory "pre-mortem" before any major platform investment:
Identify the Real Entry/Exit Points: Before designing the new UI, Process Mining is used to determine where work actually enters the system and where the final handoff actually occurs. The system must be designed to align with these real-world entry and exit points, not the theoretical ones.
Acknowledge and Automate Shadow Work: The system identifies the top 5 manual data bridges (Shadow Work) that employees use. The new platform must be engineered to automatically execute or eliminate these 5 manual steps. For example, if employees are constantly generating a manual compliance report in Excel, the new system must have that report instantly available, removing the incentive for the shadow work.
Validate Delegation and Decision Flow: Organizational Network Analysis (ONA) ensures that the decision-making paths built into the new workflow (e.g., the 3-step approval process) align with the actual power structures and delegation rights identified in the organization. If the system is designed for a Manager-level approval, but the LCO (a Knowledge Broker Bottleneck) is still required in the real world, the system must force the LCO’s input or delegate the right away.
The shift is profound: Instead of asking, "What features should the new tool have?" the question becomes, "What 10 friction points must the new tool eliminate based on the data?" This ensures that the platform is designed around the organization's unique operational reality, guaranteeing adoption and ROI.
15. Improving Performance Without Blame
Perhaps the most potent outcome of Enterprise Listening is its ability to drive performance improvement while entirely bypassing the toxic culture of blame and "accountability theater."
In low-visibility organizations, when a process fails (e.g., customer churn due to slow resolution), the natural leadership instinct is to look for a culpable individual or team. This results in time spent on punitive actions, forced stack rankings, and excessive monitoring—all of which drive fear, reduce transparency, and fail to fix the systemic cause.
A. Reframing the System vs. the Individual
Enterprise Listening enables the COO to shift the conversation using objective, de-identified evidence:
The Old Conversation (Blame): "Team X is failing to meet the 3-day SLA for claims processing. We need to apply pressure and review individual performance." (Focus on output and people).
The New Conversation (Design): "The claims process has a high failure rate because Process Step 7 (Data Reconciliation) is a bottleneck consuming 60% of the cycle time due to manual entry across three systems. The team is currently operating at maximum capacity against a broken design." (Focus on mechanism and system).
By proving that the failure is systemic and not volitional, the COO liberates the employee from judgment and redirects their energy toward problem-solving.
B. The Employee Experience Dividend (EX)
The goal is not to measure individual productivity, but to improve operational efficiency to directly enhance the employee experience (EX).
When the COO fixes a major rework loop based on Enterprise Listening data, the team responsible for that work is instantly relieved of a frustrating, repetitive task. This delivers a measurable, positive impact on morale and retention that far exceeds the value of a superficial wellness initiative.
The Proof Point: The COO can communicate: "Based on the operational intelligence, we detected that the single biggest source of frustration for the Finance team was the manual weekly reconciliation between the ERP and the invoicing tool. We have now automated that step, saving the team an average of 10 hours per week of repetitive work."
The Outcome: Employees see that "Transformation" is not something imposed on them by consultants, but a data-driven process that listens to their pain and demonstrably makes their jobs easier. This grassroots support fuels voluntary adoption of new systems and fosters a culture of continuous improvement.
16. Measuring What Moves the Operation
The final, critical step is defining success metrics that are aligned with the goal of operational advantage, not the subjective myths of productivity. Enterprise Listening mandates the adoption of mechanism metrics over output metrics.
A. Replacing Productivity Myths with Mechanism Metrics

B. The Friction Score: The COO's North Star
The ultimate metric generated by Enterprise Listening is the Operational Friction Score. This is a synthesized, weighted index that combines the major mechanism metrics into a single, executive-friendly measure of system health.


Where:
$f(\dots)$ is a composite function normalizing and weighting the key input metrics.
Cycle Time is weighted for volume and cost.
Rework Frequency is weighted for the number of affected downstream steps.
Decision Latency is weighted for the decision's strategic importance.
How it is used:
Baselining: The COO establishes a baseline Friction Score for a pilot workflow (e.g., Order-to-Cash) before any intervention.
Target Setting: The COO sets a clear objective: "Reduce the Order-to-Cash Friction Score by 20% in the next quarter."
Measuring ROI: Every automation, simplification, or policy change is tracked against its ability to move the Friction Score. If a $500,000 IT project reduces the score by 15 points, and a $50,000 policy change reduces it by 10 points, the data clearly guides future investment strategy.
Enterprise Listening is not merely a reporting capability; it is a closed-loop system for generating and validating operational advantage. It empowers the COO to lead evidence-based transformation, replacing guesswork, politics, and blame with objective data about the true structural health of the organization.
GOVERNANCE, POWER, AND ORGANIZATIONAL TRUST
The implementation of Enterprise Listening (EL) is fundamentally a political and cultural act, not merely a technical one. Introducing a capability that shines an objective light on operational reality challenges established power structures, exposes the cost of past policy decisions, and redefines how leadership is held accountable for organizational complexity. Therefore, the long-term success of EL is determined less by the accuracy of its algorithms and more by the robustness of its governance model and the clarity of its ethical boundaries.
17. Why Operational Transparency Feels Risky
Operational transparency—the ability to see exactly where and why the organization is slowing down—is the necessary prerequisite for effective transformation. Yet, for many established leaders, this transparency feels risky. This resistance stems from the political and financial implications of exposing the truth about systemic friction.
A. The Political Cost: Leadership-Created Complexity
Enterprise Listening does not blame line employees; instead, it frequently surfaces complexity created by leadership choices.
Silo Protection: The data may reveal that the decision to optimize the Finance department's software stack separately from the Sales department's stack is causing a 5-day manual reconciliation bottleneck. The owner of the Finance silo may feel exposed or challenged when the data points directly to their domain.
Past Policy Exposure: The data may show that a policy implemented years ago (e.g., the need for three separate legal approvals for a specific type of contract) is now causing a massive choke point. The leader who championed that policy must now acknowledge its operational debt.
In short, EL acts as a mirror reflecting organizational complexity back onto the leadership that designed or sanctioned the current operating model. This shift in accountability—from blaming low-level execution to diagnosing high-level design—creates natural, though often unspoken, resistance.
B. The Financial Cost: Exposing Misaligned Spend
Operational transparency directly challenges the financial wisdom of past and current transformation initiatives.
Automation Disappointment: EL can prove that millions spent on automating Process X yielded low ROI because the real bottleneck was upstream in Process Y, which was untouched. The data forces an uncomfortable conversation about past misaligned spend.
The Sunk Cost Trap: Leaders often resist abandoning a cumbersome, expensive legacy system because of the massive capital already invested in it (sunk cost). EL provides the objective data—the measured friction, the rework hours, the decision latency—necessary to finally make the evidence-based decision to divest or retire the system, overriding the emotional attachment to the investment.
To overcome this resistance, the COO must frame the transparency not as a tool for punishment, but as a mechanism for organizational maturity. The goal is to evolve from an organization that defends complexity to one that rigorously diagnoses and eliminates it.
18. The Red Lines: What Enterprise Listening Must Never Be Used For
Trust is the single most valuable, and fragile, asset in deploying Enterprise Listening. If EL is perceived as a surveillance tool, its data will immediately become useless, as employees will change their behavior to game the system (e.g., making all high-friction decisions offline or in person).
The only way to preempt this cultural failure is through non-negotiable, explicit red lines that are enforced by a governance body with real veto power. These red lines transform EL from a risk to a trusted capability.
A. The Individual Performance Wall
The core ethical boundary is the absolute separation of system diagnosis from individual discipline.
No Individual Performance Monitoring: The system must never, under any circumstances, generate a report showing the productivity, velocity, or activity level of an individually named employee. The smallest unit of analysis must be the team, process step, or functional group.
No Use in HR/Performance Reviews: Insights derived from EL data (e.g., "The Finance Team’s approval time is 48 hours") are explicitly forbidden from being used as evidence in performance appraisals, compensation decisions, or disciplinary actions.
No Behavior Scoring or Sentiment Analysis: The system cannot use pattern recognition to assess an employee’s mood, emotional state, or likelihood of compliance. It measures what happened to the work item, not the psychological state of the worker.
B. The Privacy and Content Wall
Enterprise Listening must respect the sanctity of private and proprietary communications.
Metadata Only: Analysis of communication platforms (email, chat, meetings) must be restricted to metadata (timestamps, sender/receiver, volume, subject line) or de-identified thematic tags from transcripts. The system cannot scan the content of private messages for surveillance or performance purposes.
No Covert Monitoring: The existence, purpose, data sources, and governance model of Enterprise Listening must be fully transparent to all employees and employee representative bodies (e.g., Works Councils).
These red lines are not a set of guidelines; they are the immutable operational charter of the capability. Any deviation or suggested expansion of scope that infringes on these lines must be met with an automatic veto from the governance body.
19. Who Owns Operational Truth: Governance Models That Protect Trust and Prevent Misuse
To enforce the red lines and manage the political implications of transparency, a robust, cross-functional governance model is essential. This model decentralizes the power to expand the system, ensuring no single executive can unilaterally weaponize the data.
A. The Enterprise Listening Governance Council (ELGC)
The ELGC is the non-negotiable body responsible for the oversight of the capability. Its composition must reflect the critical balance between operational need and ethical protection.
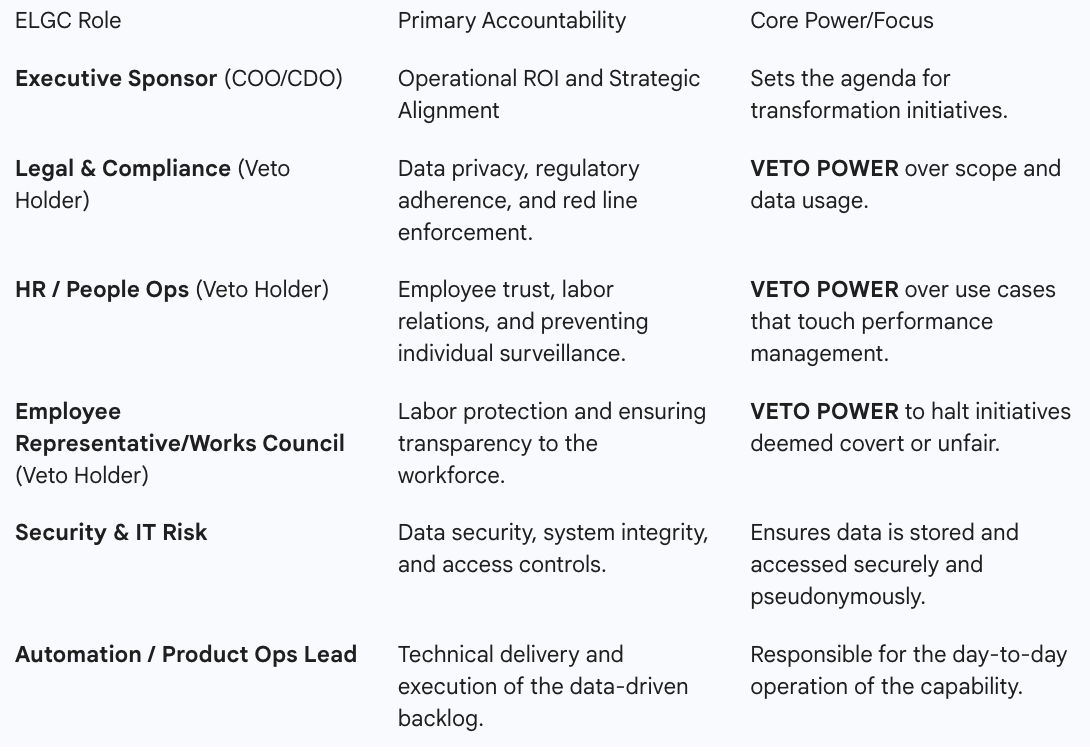
B. The Veto Power Protocol (The Non-Negotiable Check)
The Veto Holders (Legal, HR, and Employee Representatives) are not simply consultative members; they possess the power to stop any proposed use case or expansion of the system.
Mandate: Any request to expand the pilot (e.g., adding a new data source, increasing the scope beyond team-level aggregation) must be submitted in writing to the ELGC.
Veto Condition: If any one of the Veto Holders determines the proposal infringes on the red lines or violates existing labor agreements, the proposal is automatically rejected.
Effect: This protocol ensures that the organization's quest for efficiency is permanently tethered to its commitment to trust, and it provides a clear, credible mechanism for employees to escalate concerns.
The governance structure is the guarantee that Enterprise Listening will remain a tool for fixing systems and not a weapon for policing people.
20. Why This Is a COO Responsibility
Given the ethical and technical complexity of Enterprise Listening, the placement of the organizational ownership is paramount. The capability must be championed and owned by the role that has the greatest incentive for cross-functional efficiency and the least incentive for individual performance monitoring: The Chief Operating Officer (COO) or Chief Digital/Transformation Officer (CDO).
A. The COO’s Unique Alignment of Incentive
The COO is the only executive whose core mandate is to optimize the end-to-end, cross-functional flow of work.
Ownership of Workflows: The COO is accountable for major organizational workflows (Order-to-Cash, Product Launch, Customer Service Fulfillment) that cut across functional silos (Sales, Finance, Legal, IT). Enterprise Listening provides the data to manage these cross-functional dependencies, which no individual silo owner (e.g., the CFO or CIO) can see or control.
Neutrality to Individual Performance: The COO's goal is operational scale and leverage. They are neutral regarding the individual performance of a person in the Legal team or the Finance team; they only care that the handoff between the two functions is seamless. This neutrality provides the essential separation from HR's function of people management.
Accountability for Transformation ROI: Since the COO is typically accountable for delivering the realized benefits of large transformation initiatives (e.g., digitizing workflows, ERP implementations), they are the natural owner of the diagnostic tool that provides the evidence-based prioritization for that spend.
B. Why HR and IT Must Support, But Not Own
Both Human Resources (HR) and Information Technology (IT) are critical partners but should not be the owners of Enterprise Listening:
HR as Owner: The Conflict of Interest: If HR owns EL, the perception of surveillance becomes a certainty, regardless of the red lines. HR's primary function is people management, talent acquisition, and discipline. The data would immediately be suspect, and the capability would fail to gain employee trust. HR's role must be the enforcement of the red lines and the championing of the ethical contract, not the driver of operational insight.
IT as Owner: The Lack of Operational Context: If IT owns EL, it will be treated as another tool or data warehouse, lacking the necessary operational context to drive change. IT is responsible for the technical integrity and security of the data, but the operational interpretation—the question of "Which rework loop costs the most money?"—must be answered by the team accountable for that cost, which is Operations.
The COO must step forward, claim ownership of operational truth, and enforce the governance model. This positions Enterprise Listening as an organizational system audit led by the transformation executive, securing the operational advantage and cultural trust necessary for its long-term success.
RUNNING A SAFE PILOT
The successful introduction of Enterprise Listening (EL) requires more than just executive approval; it requires a strategic, trust-building deployment that demonstrates value while rigorously upholding the non-negotiable governance principles. This is achieved through a tightly scoped, 90-day pilot that is "safe by design," focusing on a manageable workflow and ensuring that the first delivered insights reinforce the commitment to system improvement, not employee monitoring.
21. The 90-Day Listening Pilot: How to Introduce Enterprise Listening Without Triggering Resistance
The pilot is the crucial proof-of-concept phase. Its primary objectives are to validate the technology's ability to connect disparate data streams, demonstrate the value of the insights, and, most importantly, establish organizational trust. Any failure in governance or scope during the pilot can permanently derail the initiative.
A. Pilot Scope: Safe by Design
The pilot must be intentionally small, limited, and focused on demonstrating the core value proposition: fixing cross-functional friction.
Select a Single, End-to-End Workflow: The chosen workflow must be cross-functional (i.e., touching at least 3-4 distinct teams/silos) but operationally contained.
Example Choices:
Order-to-Cash (O2C): From the moment a customer places an order to the final cash receipt and reconciliation.
Internal Service Request (ISR): From an employee submitting an IT or HR request to its final resolution.
New Product Introduction (NPI) Coordination: From the product concept handoff to the operations team through launch readiness.
Why this works: Focusing on a complete workflow guarantees the capture of handoff friction—the exact blind spot EL is designed to solve.
Limit Teams and Tools: Restrict the pilot to the 2-3 core teams directly responsible for executing the chosen workflow. Restrict data ingestion to a limited set of tools (e.g., the ERP log, the CRM log, and collaboration metadata for only those teams). This minimizes the initial security and compliance footprint.
Strict Aggregation Level: Insights must be aggregated and presented only at the team or process level. The system must be configured to block any attempt to drill down to individual identifiers, reinforcing the "No individual performance monitoring" red line.
Read-Only Insights: The initial pilot must focus solely on diagnosis. The system generates reports and models but has no connectivity to execution systems (i.e., it cannot automatically trigger an action or automation). This lowers the perceived risk of unintended consequences.
B. The Pilot Communications Strategy: Transparency is Trust
The way the pilot is communicated is as important as its technical execution.
Communicate Early, Be Explicit: Before data collection begins, the Executive Sponsor (COO/CDO) and the HR/Employee Representatives from the Governance Council must jointly announce the pilot to the involved teams.
Reinforce the Red Lines: The communication must lead with the What It Will NEVER Do list (Section 18). Employees must be repeatedly assured that the data cannot and will not be used for performance reviews or discipline.
Frame the Goal as EX Improvement: Position the pilot not as a quest for efficiency, but as an initiative to "fix the system that makes your job frustrating." Use language like: "We are listening to the complexity to eliminate the rework loops and unnecessary meetings that slow down the process for you."
Share the Governance Model: Announce the establishment of the Governance Council and explicitly name the Veto Holders (Legal, HR, Employee Reps), demonstrating that the capability is institutionally protected against misuse.
The 90-day duration provides enough time to capture meaningful trends and anomalies while remaining short enough to manage employee anxiety and deliver actionable results.
22. What Organizations Discover Every Time
Despite vast differences in industry, scale, and technology stack, Enterprise Listening pilots consistently reveal the same three structural failure patterns. These repeating patterns confirm that the biggest operational problems are universal design flaws, not unique execution failures.
A. The 80/20 Rule of Dwell Time
Every pilot confirms that the majority of cycle time is spent waiting, not working.
The Discovery: Process Mining universally reveals that 80-90% of the end-to-end cycle time for any complex workflow is consumed by Dwell Time (the time the work item is waiting in a queue or for approval/handoff) rather than Processing Time (the time a person or system is actively working on it).
The Insight: This immediately debunks the myth that employees are slow or unproductive. It proves that the bottleneck is the lack of system responsiveness and the structural dependencies built into the process. Time is not lost to laziness; it is lost to organizational inertia.
The Action: Focus the entire transformation backlog on reducing Dwell Time by clarifying delegation, implementing automated routing, or resolving the one-person-approver bottleneck.
B. The Centrality of the "Knowledge Broker"
Organizational Network Analysis (ONA) consistently identifies a small number of individuals who are disproportionately central to the resolution of exceptions.
The Discovery: ONA reveals that 2-3 individuals, often senior analysts or mid-level managers, are the central nodes for decision-making and exception handling, particularly across silos. Their collaboration metadata volume is orders of magnitude higher than their peers, and their involvement correlates with the resolution of high-friction tasks.
The Insight: These individuals are not being rewarded for their efficiency; they are being penalized for their institutional knowledge. They are acting as manual, human middleware—the organization's capacity for complex work is limited by their available hours. Their heavy involvement signals that the process rules are not digitized or scalable.
The Action: The organization must prioritize the extraction and codification of this individual's knowledge into a structured decision-support system, an expert-system, or a clear policy. The goal is to offload their "broker" function, allowing them to focus on high-value, novel problems.
C. The Dominance of the Rework Loop
The most costly and frustrating structural flaw, the rework loop, is found in every cross-functional handoff.
The Discovery: Conformance Checking reveals that 30-40% of all work instances in the pilot workflow do not follow the "happy path" (the documented process). Instead, they are returned to a prior step due to an error, missing data, or lack of sign-off. The same three teams are consistently looping work back and forth.
The Insight: The organization is spending a massive amount of effort (salary, time, mental load) fixing its own mistakes. The cause of the rework is almost never malicious; it is a failure of the quality gate at the handoff. The upstream team is incentivized to pass the work quickly, while the downstream team is incentivized to enforce quality, leading to the conflict.
The Action: This insight is the strongest driver for automation investment. The most immediate ROI is achieved by deploying automated data validation at the point of handoff, preventing incomplete work from ever entering the next stage.
23. When Visibility Changes Culture: From Blame to Systems Thinking
The true long-term value of Enterprise Listening is cultural, not just operational. By providing objective, systemic data, the capability fundamentally shifts the organization's default response to failure, transforming a culture of blame into a culture of continuous improvement and systems thinking.
A. The End of Accountability Theater
In the absence of data, organizations rely on "accountability theater"—publicly assigning blame to a person or team to satisfy the perception that "something is being done."
Before EL: A major order fails due to slow fulfillment. The COO asks, "Who dropped the ball?" and the manager of the final execution team is reprimanded. The problem repeats next month.
After EL: A major order fails. The EL report immediately shows that the 5-day delay was caused by the Legal Approver bottleneck (Section 22.A) and the Rework Loop between Sales and Finance (Section 22.C). The COO asks, "What is the structural cause of this bottleneck?"
The discussion shifts from "Whose fault is it?" to "Which system design choice is causing this fault?" This change in inquiry is profound: it moves the cognitive energy of the organization away from defensive politics and toward collaborative problem-solving. It creates psychological safety for employees to admit friction, knowing that the data will protect them from arbitrary blame.
B. The Rise of the Systems Thinker
Enterprise Listening empowers operational staff and managers to become "systems thinkers" who see their work not as isolated tasks, but as steps in a larger, interconnected flow.
Empowerment: When a manager can present data proving, "My team is delayed not because we are slow, but because the upstream process provides us with incomplete data 40% of the time, forcing us into a 4-hour rework loop," they move from a defensive position to a consulting position. They are now armed with objective evidence to demand a change from the upstream team.
Collaboration: The data acts as an objective, neutral third party. When two siloed teams (e.g., Marketing and Product) disagree on why a process stalls, the EL data reveals the specific handoff where the work item stops, allowing them to stop arguing over perception and start collaboratively designing a fix based on execution reality.

C. Evidence-Based Prioritization: Ending the Opinion War
In high-stakes transformation meetings, decisions are often driven by the Highest Paid Person’s Opinion (HiPPO) or by the functional executive who shouts the loudest.
Before EL: The Head of Sales argues that their CRM system needs the most investment. The Head of Finance argues their ERP is the biggest problem. The budget is split based on internal political pressure.
After EL: The COO presents the Execution Backlog (Section 13). The data shows that the Rework Loop between Sales and Finance, caused by an integration gap, is responsible for 4,000 hours of lost time per month—the single largest friction point.
The Outcome: Investment decisions are instantly depoliticized. The focus shifts to fixing the highest-value pain point identified by the data, eliminating subjective arguments and ensuring that every transformation dollar targets the point of maximum leverage.
The successful pilot, communicated with integrity and governed strictly by its red lines, serves as the organizational proof point: The organization is listening to fix itself, not to judge its people. This demonstration is the core requirement for scaling Enterprise Listening from a pilot into a permanent, trusted operational capability.
THE OPERATING MODEL OF THE FUTURE
Enterprise Listening (EL) is not merely a tool for process improvement; it is the foundational data layer required for the next generation of operational models. By moving from lagging, incomplete data to continuous, systemic intelligence, the Chief Operating Officer (COO) can transition the organization from reactive management to a proactive, evidence-based, and ultimately, autonomous enterprise. This final part defines the strategic role of EL in the modern C-suite and outlines the practical roadmap for achieving a truly "Listening Enterprise."
24. AI, Agents, and Self-Improving Operations
The goal of modern digital transformation is not just to digitize existing processes, but to create operations that are intelligent, resilient, and capable of self-correction. Enterprise Listening is the critical, missing infrastructure that makes true autonomous operations possible.
A. The Data Requirement for True AI
Artificial Intelligence (AI), Machine Learning (ML), and Robotic Process Automation (RPA) are the execution layer of the autonomous enterprise. However, they require a specific type of data to move beyond simple, rule-based tasks:
Objective Execution Data: AI needs to see how the process actually executes, including all the exceptions, workarounds, and rework loops. Traditional ERP data only shows the "happy path" transactions; EL, via Process Mining, provides the rich, messy execution log required to train sophisticated models.
Friction and Cost Metrics: An intelligent automation agent cannot decide where to deploy itself unless it has a quantified friction score (Section 16). EL provides the cost-of-friction data necessary to prioritize which parts of the workflow should be automated first, ensuring that AI investment targets the highest ROI.
Cross-Functional Context: An AI agent deployed to improve customer service needs to understand that its delay is caused by a decision latency in the Legal department. EL's Organizational Network Analysis (ONA) provides this cross-functional context, enabling AI to identify systemic failures outside its own domain.
Without Enterprise Listening, AI and automation are forced to operate in a vacuum, leading to Misaligned Automation Spend (Section 4) and the costly process of Automating the Mess (Section 4).
B. The Foundation for Intelligent Agents
The ultimate ambition is the deployment of Intelligent Automation Agents—software that can not only execute tasks but also diagnose friction and suggest process changes.
Diagnosis and Recommendation: An intelligent agent, continuously fed EL data, can detect when a Dwell Time bottleneck (Section 9) suddenly increases by 50% above the historical baseline. It doesn't just flag the issue; it uses the EL data to suggest the fix: "Based on historical ONA data, the cause is a new compliance requirement added to the 'Risk Review' node. Recommendation: Delegate approval authority for this class of requests to the level of Senior Manager, reducing the average approval time from 72 hours to 8 hours."
Predictive Operations: EL moves beyond diagnosis to prediction. By training models on the correlation between specific data signals (e.g., high email density between Team A and B combined with a sudden spike in open tickets in System C), the organization can predict a process breakdown before it results in customer pain or financial loss.
The shift: EL turns the COO’s focus from reacting to problems to designing the operational system that intelligent agents will manage, making the COO the chief architect of the self-improving enterprise.
25. The End of Gut-Feel Operations
For decades, operational management, particularly at the executive level, has been a domain of intuition, experience, and subjective judgment. The "gut feeling" of a seasoned COO, while valuable, often fails at scale because complexity overwhelms human cognitive capacity. Enterprise Listening replaces this intuitive, subjective management with evidence-based, objective operations.
A. Replacing Intuition with Evidence
EL forces every major operational decision to pass an objective test:
Investment Decisions: Instead of funding the loudest executive's priority, the COO funds the project with the highest quantified Friction Score Reduction (Section 16). The conversation shifts from "We think this system is slow" to "The data proves that this specific integration failure is costing us 4,000 hours per month."
Organizational Design: Decisions about merging teams, restructuring departments, or delegating authority can now be tested against the Decision Latency and Rework Loop data (Section 10). If the data shows two teams require excessive collaboration loops due to separation, the decision to physically or structurally merge them is evidence-backed.
Talent Management (Systemic View): Instead of intuitively guessing who the highest-impact individuals are, the COO uses the Knowledge Broker data (Section 22) to objectively identify individuals whose institutional knowledge poses the highest systemic risk. This shifts resources to knowledge transfer and documentation, protecting the organization from catastrophic single-point-of-failure dependencies.
B. Managing by Exception and Standard Deviation
EL allows the COO to manage operational variance, the hidden cost of inconsistent execution.
Process Consistency: The system measures the standard deviation of cycle time for a single process across different regions or teams. If the global average for "Invoice Processing" is 5 days, but the APAC region's standard deviation is twice as high as the EU region's, the COO knows that APAC's process is inconsistent. The action is not to blame the APAC team, but to force the adoption of the more consistent EU process model.
Managing Exceptions: The system can automatically flag exceptions (instances that exceed a predefined threshold for Dwell Time or Rework Loops) and use the EL data to route these exceptions not to a manual review queue, but to the team best equipped to resolve that specific type of failure, based on historical data.
This shift allows the COO to stop managing the average and start managing the variance, ensuring operational outcomes are predictable and repeatable at scale.
26. Becoming a Listening Enterprise: A Practical Roadmap for COOs
Transitioning to a Listening Enterprise is a structured, multi-phase journey that prioritizes trust and demonstrable value delivery over speed of deployment. The COO must manage this transition as a strategic culture change program, not just an IT project.

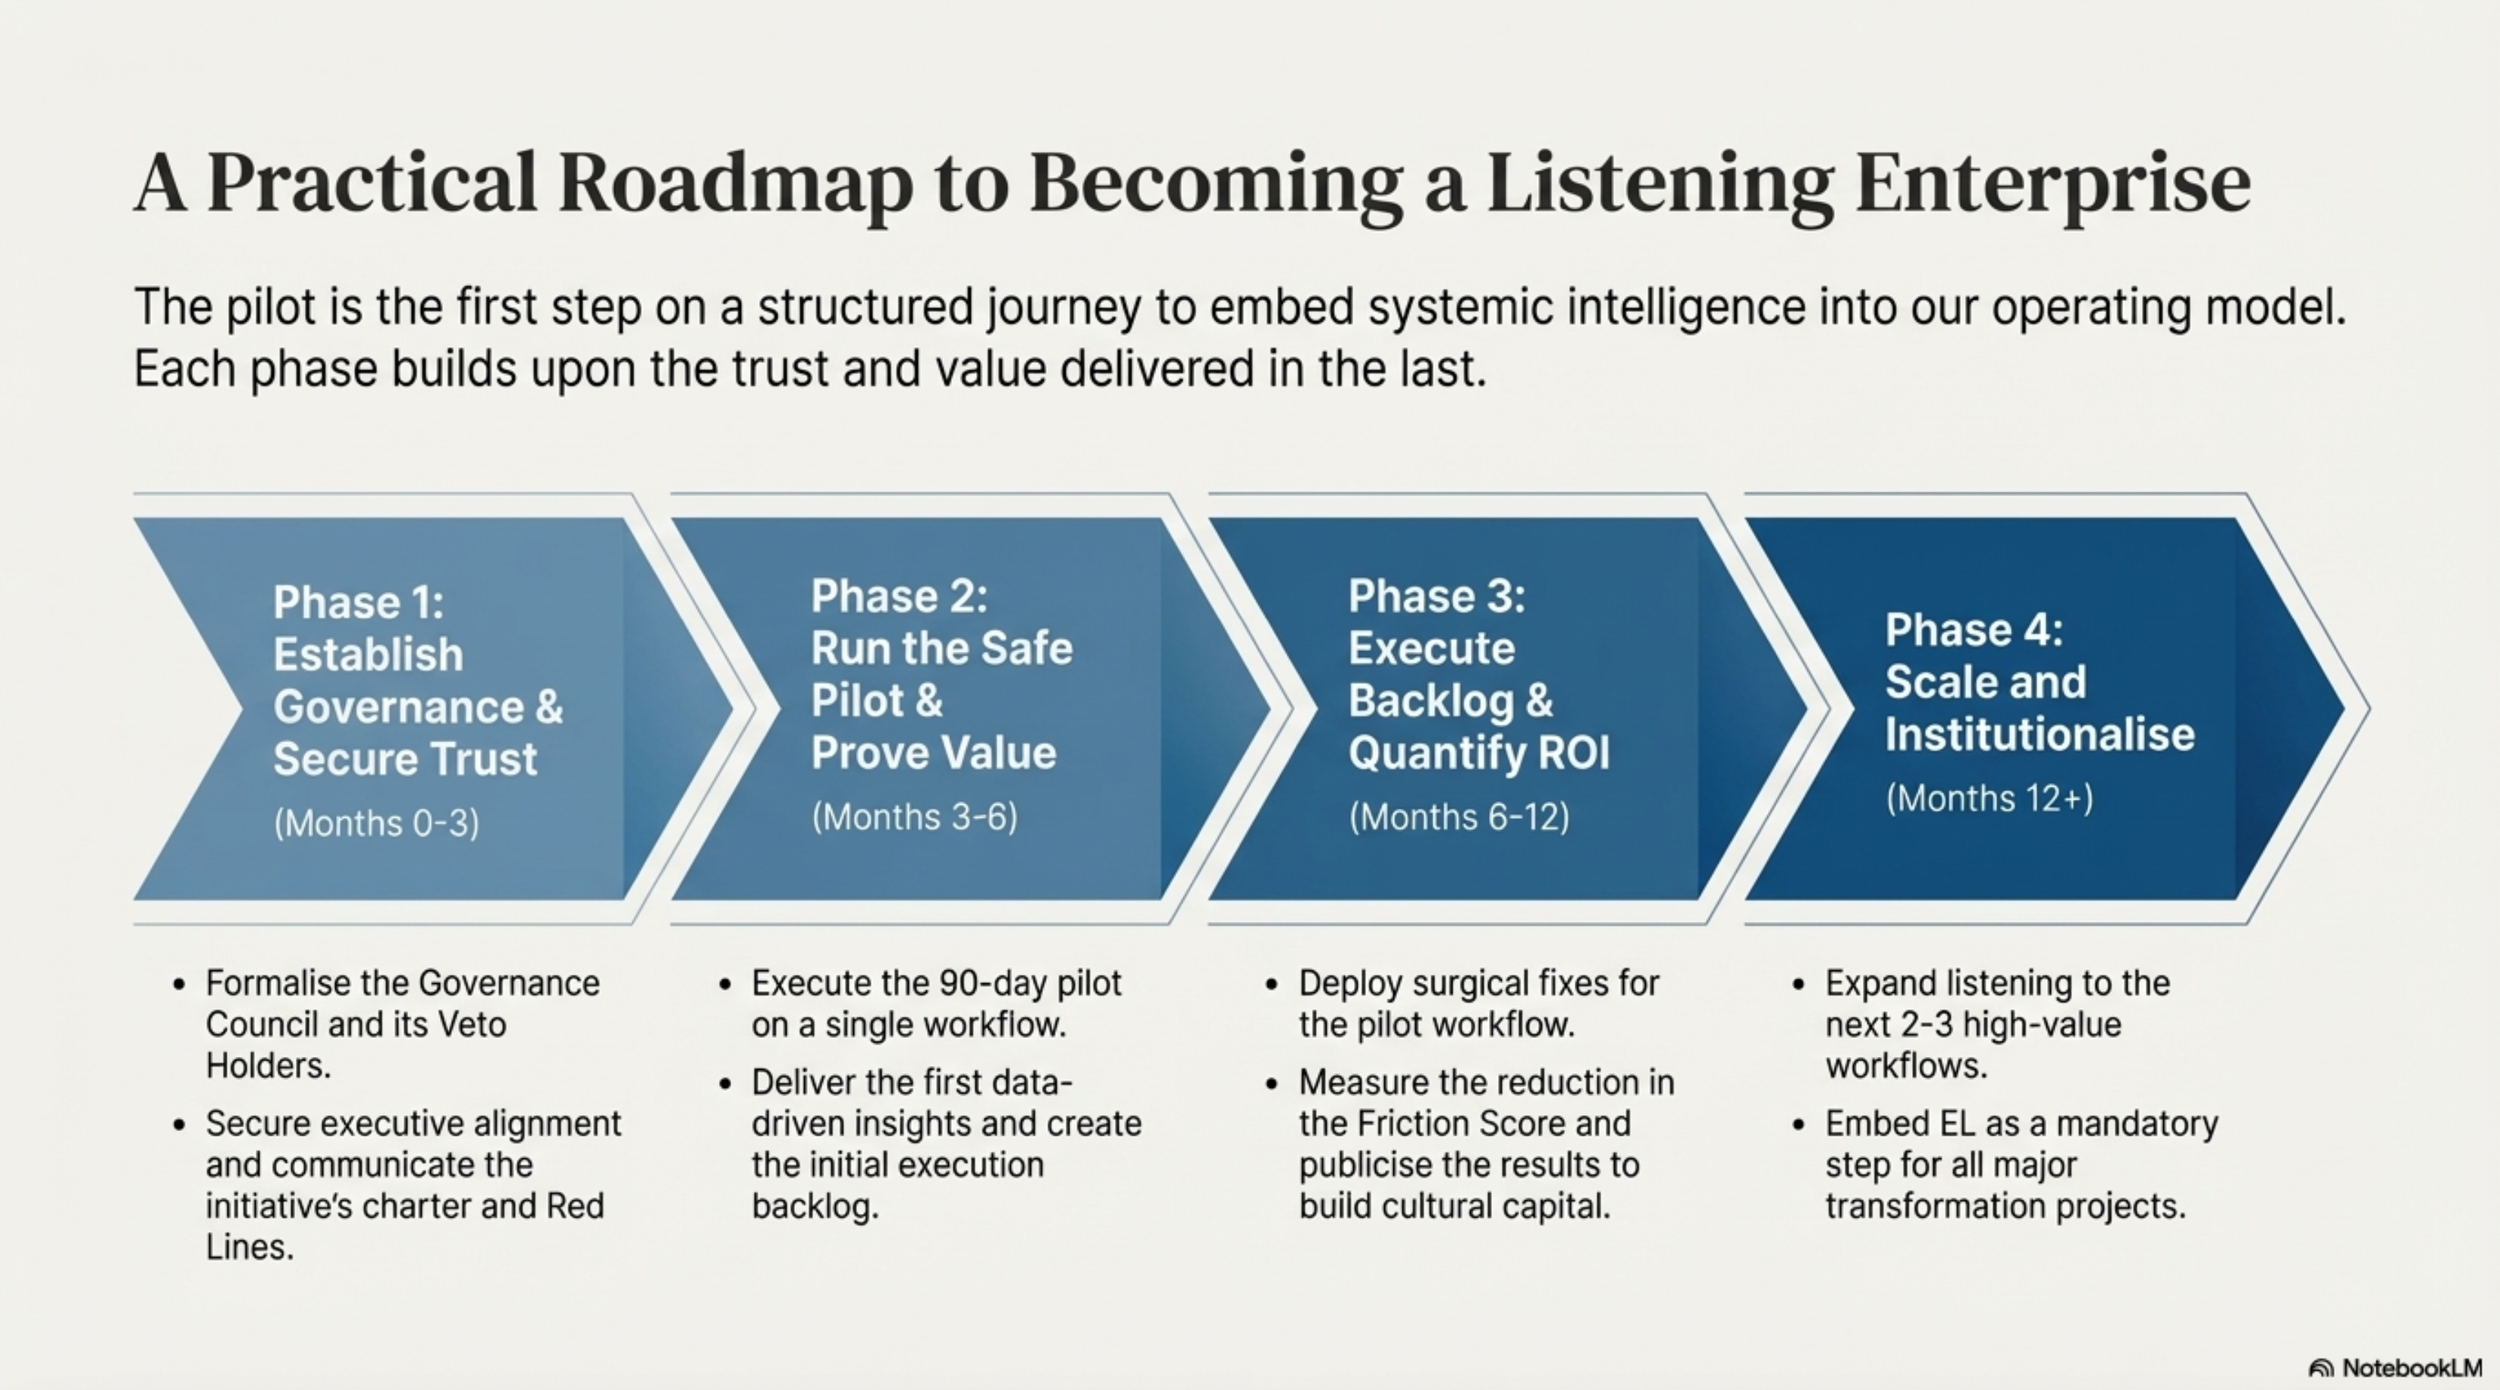
Phase 1: Establish Governance and Secure Trust (0-3 Months)
The foundation of the entire initiative is the ethical framework and organizational buy-in.
Action 1: Secure Executive Alignment: Present the proposal (Parts I-V) to the executive team, emphasizing the separation from employee monitoring. Secure the mandate for the pilot and the budget for the Governance Council.
Action 2: Establish the Governance Council (ELGC): Formalize the charter, appoint all Veto Holders (Legal, HR, Employee Reps), and mandate their non-negotiable authority. This is the organizational insurance policy.
Action 3: Public Communication and Transparency: Announce the initiative company-wide, focusing on the goal (fix systems, reduce employee friction) and the explicit Red Lines (Section 18).
Phase 2: Run the Safe Pilot and Prove Value (3-6 Months)
This phase validates the technology and builds credibility among operational staff.
Action 4: Tightly Scope the Pilot: Select one cross-functional workflow (e.g., Order-to-Cash), restrict it to 2-3 core teams, and limit data sources (Section 21).
Action 5: Data Ingestion and Model Building: Collect and pseudonymize data logs. Run the Process Mining and ONA models to establish the baseline Friction Score for the pilot workflow.
Action 6: Deliver First Insights (The Aha! Moment): Present the results exclusively to the Executive Sponsor and the pilot teams. Focus the initial report on the most egregious Rework Loop and Bottleneck (Section 22). Example: "Your team is spending 30% of its time on rework caused by incomplete inputs from the upstream team."
Phase 3: Execute the Backlog and Quantify ROI (6-12 Months)
The success of the pilot must immediately translate into verifiable operational fixes.
Action 7: Prioritize the Execution Backlog: Use the quantified impact of the insights (time cost, rework frequency) to prioritize the top 5 fixes (Section 13). Categorize them as Automation, Simplification, or Policy Change.
Action 8: Execute Surgical Fixes: Deploy short, high-impact fixes (e.g., automate the top rework loop, clarify the single-point-of-failure approval).
Action 9: Measure and Publicize the Change: Rerun the EL models on the pilot workflow after the fixes are deployed. Publicly communicate the measurable impact: "We reduced the Order-to-Cash cycle time by 2 days, reducing the Friction Score by 15 points. This saved 1,000 hours of employee rework." This is how trust is converted into cultural capital.
Phase 4: Scale and Institutionalize (12+ Months)
Embed Enterprise Listening as a permanent function of the operational model.
Action 10: Expand Scope and Data: With ELGC approval, expand listening to the next 2-3 high-value workflows (e.g., Procure-to-Pay, Marketing-to-Sales Handoff). Integrate the EL data stream into the core Business Intelligence (BI) layer.
Action 11: Embed EL in Transformation: Make EL a mandatory Phase 0 for all major transformation projects, forcing every new platform and automation investment to be validated by EL data.
Action 12: Evolve to Predictive Capability: Shift from diagnosing past problems to using the data to predict future bottlenecks and assign intelligent agents to proactively manage process deviations, creating a truly self-improving operation.
By following this roadmap, the COO doesn't just implement a new tool; they fundamentally change the nature of operational truth within the organization, securing a lasting competitive advantage founded on evidence and trust. The Listening Enterprise operates at a level of speed, efficiency, and intelligence that competitors relying on gut-feel and lagging indicators simply cannot match.
